Introduction
This user guide covers Njord's two main products:
- Njord Analytics — a web app for sailing performance analysis. Upload log files, explore races, and build a long-term performance record.
- Njord Player — a Windows/Mac app (also available in the browser) that combines video and data for visual team debriefs.
Most teams use both together: data uploaded to Analytics flows into Player automatically, so you only import once. See Analytics and Player Together.
Where to start
New to Analytics? → Analytics overview
New to Player? → Player overview
New to both? Start with Analytics — upload your first log file, explore your data, then add Player when you're ready for video debriefs.
For help with your user account, see Your Njord Account.
Getting More Help
Find example workflows under Other Resources
In case this document does not answer your question, please contact us.
Using Analytics and Player Together
Njord Analytics and Njord Player are designed to complement each other. When used together, you only import your log file once — everything else flows through automatically.
How it works
On the water
  └─ Instruments log data

At the dock
  └─ Upload log file to Njord Analytics
       → Races and legs detected automatically
       → Whole team can view and analyse data immediately

Before the debrief
  └─ Open Njord Player → File → Download from Njord Analytics
       → Race structure and comments load automatically
       → Add video/photo files (aligned to the timeline automatically)

In the debrief
  └─ Play back video alongside live data and map, all in sync
What carries over from Analytics to Player
When you use File → Download from Njord Analytics in Player, it pulls:
- Processed boat data
- Race and leg structure (start times, mark roundings)
- Comments and sail changes logged on the water
This is a snapshot — changes made in Analytics after the download are not reflected in Player automatically. Download again if needed.
What each product is best for
| Njord Analytics | Njord Player | |
|---|---|---|
| Access | Any browser, any device | Desktop app (Windows/Mac) or Web Player |
| Best for | Performance analysis, data review, sharing | Visual team debriefs with video |
| Data input | Upload log file | Download from Analytics, or load file directly |
Player without Analytics
You can use Player without an Analytics subscription by loading log files directly from disk. See Loading Data. Data loaded this way is not available in Analytics.
Your Njord Account
To use either Njord Analytics or Njord Player, you need a Njord user account which is tied to your email address.
Signing Up
- Visit app.sailnjord.com/login and select Sign Up
- Enter your email address and a password of your choice
- You will receive an email with a confirmation code
- Enter this code in the signup form to complete the signup
When signing up fails, you may already have a user account with that email address, perhaps because someone invited you a while ago. In that case, try resetting your password (see below).
In Case You Don't Remember Your Password
- Visit app.sailnjord.com/login and select Reset Password
- Enter your email address and click Reset Password
- You will receive an email with a confirmation code
- Enter this code and a new password of your choice to complete the password reset
Overview
Njord Analytics and Njord Player support the same types of files for loading data, and the process to load data looks the same in both Njord Analytics and Njord Player.
You can find the full list of supported data types at www.sailnjord.com/data-sources.
When uploading multiple files for the same session (e.g. a main log file and a supplementary heart rate or wind file), upload them together and set the File Purpose for each file:
- Base Data — the primary log file, which must contain GPS position and absolute timestamps
- Extra Data — supplementary files (additional sensors, CSV files with relative timestamps, event logs)
- Wind Data — dedicated wind files; Njord applies configurable damping and merges wind channels into the session
For standard Njord metric names used in CSV column headers, see Metrics. For calculated metrics and custom formulas, see Formulas.
Metrics
Below is a list of all standard Njord metric names. These have special meaning in the software, are used to calculate derived metrics, and some features are only enabled when these metrics are present.
When loading data from any data source, we will rename data to match these standard metrics. When importing data in CSV format, name the CSV columns to match the metric names below for the best experience.
Depending on the data source, you can include any number of additional metrics with custom names. They will all be shown in the software, but don't carry any special meaning.
| Name | Description | Unit | Calculated |
|---|---|---|---|
AWA | Apparent wind angle | degrees | |
AWA_Abs | Apparent wind angle (absolute) | degrees | yes |
AWS | Apparent wind speed | knots | |
BelowLine | Distance from boat's bow to start line (perpendicular), from log file | meters | |
BelowLineCalc | BelowLine, calculated from start line entered for race | meters | yes |
BoatSpeed (BSP) | Boat speed (speed through water) | knots | |
BoatSpeedPercOfPolar (Polar%) | Boat speed as a percentage of the polar target speed (requires a polar to be set for the boat) | percent | yes |
BoatSpeedPercOfTarget (BSP%) | Boat speed as a percentage of the target boat speed from the polar | percent | yes |
COG | Course over ground (true or magnetic) | degrees | |
COG_Mag | Course over ground (magnetic) | degrees | yes |
COG_True | Course over ground (true) | degrees | yes |
CurrentDirection | Direction of current (set) | degrees | |
CurrentSpeed | Speed of current (drift) | knots | |
DistanceToLeader | Distance to leader (available in race with full course) | meters | yes |
Foiling | 1 if foiling, 0 if not foiling | ||
Forestay | Forestay load or tension | ||
Heading | Heading (true or magnetic) | degrees | |
Heading_Mag | Heading (magnetic) | degrees | yes |
Heading_True | Heading (true) | degrees | yes |
Heel | Heel (roll) | degrees | |
Heel_Abs | Heel (absolute) | degrees | yes |
Heel_Lwd | Heel to leeward — sign-adjusted so that positive always means heeling to leeward regardless of tack | degrees | yes |
Lat | Latitude (as recorded) | degrees | |
LatBow | Latitude of boat's bow | degrees | yes |
LatCenter | Latitude of the center of the boat | degrees | yes |
LatStern | Latitude of boat's stern | degrees | yes |
Leeway | Leeway angle — angular difference between the boat's heading and its actual course through the water | degrees | |
Leg | (available in race with full course) | yes | |
Lon | Longitude (as recorded) | degrees | |
LonBow | Longitude of boat's bow | degrees | yes |
LonCenter | Longitude of the center of the boat | degrees | yes |
LonStern | Longitude of boat's stern | degrees | yes |
Log | Distance traveled over ground | meters | yes |
LogAlongCourse | Distance traveled along race course axis | meters | yes |
MagneticVariation | Local magnetic variation (declination), used to convert between true and magnetic bearings | degrees | yes |
PolarBoatSpeed | Target boat speed from the polar for the current TWA and TWS | knots | yes |
Portlat | Latitude of port / pin end of line | degrees | |
Portlon | Longitude of port / pin end of line | degrees | |
Rank | (available in race with full course) | yes | |
ROT | Rate of turn | degrees per second | yes |
Rudder | Rudder | degrees | |
Rudder_Abs | Rudder (absolute) | degrees | yes |
Rudder_Lwd | Rudder to leeward | degrees | yes |
SOG | Speed over ground | knots | |
Stbdlat | Latitude of starboard / RC end of line | degrees | |
Stbdlon | Longitude of starboard / RC end of line | degrees | |
TargetBoatSpeed | Target boat speed from the polar for the current TWA and TWS | knots | yes |
TargetForestay | Target forestay value from the polar | yes | |
TargetHeel | Target heel from the polar | degrees | yes |
TargetRudder | Target rudder from the polar | degrees | yes |
TargetTrim | Target trim from the polar | degrees | yes |
TargetTWA | Optimum TWA (best VMG angle) for the current TWS from the polar | degrees | yes |
TargetTWADelta | Difference between actual TWA and the target TWA from the polar | degrees | yes |
TargetVMG | Target VMG from the polar at the optimum TWA for the current TWS | knots | yes |
Target<Anything> | Target for any other <Anything> metric | ||
TimeLocal | Seconds since midnight (local time) | seconds | yes |
TimeToBurn | Time available to burn before crossing the start line early (requires BelowLine or BelowLineCalc and TimeToGun/TimeToGunCalc) | seconds | |
TimeToGun | Time to gun, from log file (negative after the start) | seconds | |
TimeToGunCalc | Time to gun, calculated from the race start time entered in Njord (negative after the start) — use this when the log file does not contain TimeToGun | seconds | yes |
TimeToLine | Estimated time to cross the start line at current boat speed | seconds | |
TimeUTC | Seconds since midnight (UTC) | seconds | yes |
Trim | Trim (pitch) | degrees | |
Trim_Abs | Trim (pitch) absolute value | degrees | yes |
TWA | True wind angle | degrees | |
TWA_Abs | True wind angle (absolute value) | degrees | yes |
TWD | True wind direction | degrees | |
TWS | True wind speed | knots | |
VMC | Velocity made on course | knots | yes |
VMG | Velocity made good | knots | yes |
VMGPercOfTarget (VMG%) | VMG as a percentage of the polar target VMG | percent | yes |
XTE | Cross track error | meters | yes |
Yaw | Yaw angle | degrees |
Formulas
The formula syntax below can be used to add calculated variables when loading data:
- In the upload screen in Njord Player or Njord Analytics
- In Njord Analytics, modify already uploaded data by selecting the uploaded data segment (Data section), and select Process
- In Njord Analytics, configure one or more formulas to be applied every time data is uploaded to a certain boat. Set this up under Boat - Settings - Process
Examples
| Formula | Description |
|---|---|
Heading - COG | Difference between Heading and COG |
DELTAPERSEC(UNWRAP(Heading)) | Rate of turn in degrees per second |
DELTAPERSEC(BoatSpeed) * 60 | Acceleration in knots per minute |
BoatSpeed / -(FILTER(DELTASEC(BoatSpeed, 10), DELTASEC(BoatSpeed, 10) < 0) / 10) | When decelerating, how many seconds to zero knots at current 10 second deceleration average |
INTERPOLATED(SERIES("2022-10-01T08:00+02:00", 10, "2022-10-01T11:00+02:00", 14)) | This could be TWS rising from 10 kts at 8 am to 14 kts at 11 am, for example |
0.012 * Heel / (BoatSpeed * BoatSpeed) | Leeway angle estimate — assign this formula to the Leeway metric. Adjust the constant 0.012 to match your boat class. |
SELECTPORTSTBD(PortFoilLoad, StbdFoilLoad) | Leeward foil load — selects the port foil value on port tack and the starboard foil value on starboard tack |
COALESCE(FILTERPORT(PortFoilLoad), FILTERSTBD(StbdFoilLoad)) | Alternative leeward foil load using COALESCE with tack filters |
Heading + 90 | Correct heading for a device mounted 90° off the centreline — assign to Heading |
MAPLINEAR(AnalogIn1, 0.5, 0, 4.5, 100) | Map a 0.5–4.5 V analog sensor signal (from a B&G H5000 analog input) to a 0–100 range |
Operators
| Operator | Description | Notes |
|---|---|---|
+ | Addition | |
- | Subtraction | |
* | Multiplication | |
/ | Division | |
< | Less than | To be used with FILTER() |
<= | Less than equal | To be used with FILTER() |
> | Greater than | To be used with FILTER() |
>= | Greater than equal | To be used with FILTER() |
== | Equals | To be used with FILTER() |
!= | Not equals | To be used with FILTER() |
& | Logical and | To be used with FILTER() |
| | | Logical or | To be used with FILTER() |
! | Negate | To be used with FILTER() |
Functions
| Function | Description |
|---|---|
ABS(value) | Absolute of value / remove sign |
SIGN(value) | Returns an indication of the sign of values, -1, 0, or 1. |
MIN(value1, value2) | Minimum of two values |
MAX(value1, value2) | Maximum of two values |
MOD(a, n) | Modulo operation |
SIN(value) | Sine of value (which is expected to be in degrees) |
COS(value) | Cosine of value (which is expected to be in degrees) |
ARCTAN2(x, y) | Element-wise arc tangent (in degrees) of x/y choosing the quadrant correctly. |
FILTERPORT(value) | Retains the value only on port tack (AWA between -170 and -10) |
FILTERSTBD(value) | Retains the value only on starboard tack (AWA between 10 and 170) |
COALESCE(value1, value2) | Choose value1 if it's not empty, else value2 |
SELECTPORTSTBD(valuePort, valueStbd) | Select valuePort when sailing on port tack, valueStbd on starboard tack |
UNWRAP(value) | Removes wrap at 0/360 degrees, instead expands value below 0 or above 360 as needed for safe calculations |
SHIFT(value, rows) | Shifts value (series) by given number of rows |
SHIFTSEC(value, seconds) | Shifts value (series) by given number of seconds |
DELTASEC(value, seconds) | Delta of value compared to second seconds ago |
DELTAPERSEC(value) | Delta of value compared to previous datapoint, divided by number of seconds since last datapoint |
ROLLINGMEAN(value, seconds) | Rolling mean over second seconds |
ROLLINGSUM(value, seconds) | Rolling sum over second seconds |
FILTER(value, mask) | Filters value using the given mask, returning empty value where the mask is false |
INTERPOLATED(value) | Fill blanks between values by linear interpolation |
INTERPOLATEDBEARING(value) | Fill blanks between values by linear interpolation, correctly handling 0/360 degree wrap around |
SERIES(time1, value1, time2, value2, ...) | Produces a data series with the given values at the given times. Write times in ISO 8601 format with quotes, like "2022-10-01T10:00+02:00". Use with INTERPOLATED(). |
TWA(awa, aws, sog) | Calculates true wind angle from apparent wind and SOG/boat speed |
TWS(awa, aws, sog) | Calculates true wind speed from apparent wind and SOG/boat speed |
AWA(twa, tws, sog) | Calculates apparent wind angle from true wind and SOG/boat speed |
AWS(twa, tws, sog) | Calculates apparent wind speed from true wind and SOG/boat speed |
INTEGRATE(value, gap) | Integration over time (in seconds) using the trapezoidal rule. gap is optional (defaults to 10 seconds) - any gaps in data greater than this are omitted. |
MAPLINEAR(value, x1, y1, x2, y2[, ...][, xn, yn][, extrapolate]) | For each value between x1 and x2, produces an output value between y1 and y2 using linear interpolation, between x2 and x3 interpolates between y2 and y3, etc. If extrapolate is 1 or true, input values below x1 and above the highest xn value are mapped using extrapolation of the nearest linear pair, otherwise those output values will be empty. |
Note: all function names are case insensitive and may be written in lower case too.
Notes
Metric names with special characters or spaces must be wrapped in double quotes when used in a formula. For example, a channel named Forestay Load from a custom instrument must be referenced as "Forestay Load". Standard Njord metric names (listed in Metrics) do not contain spaces or special characters and do not need quoting.
Frequently Asked Questions
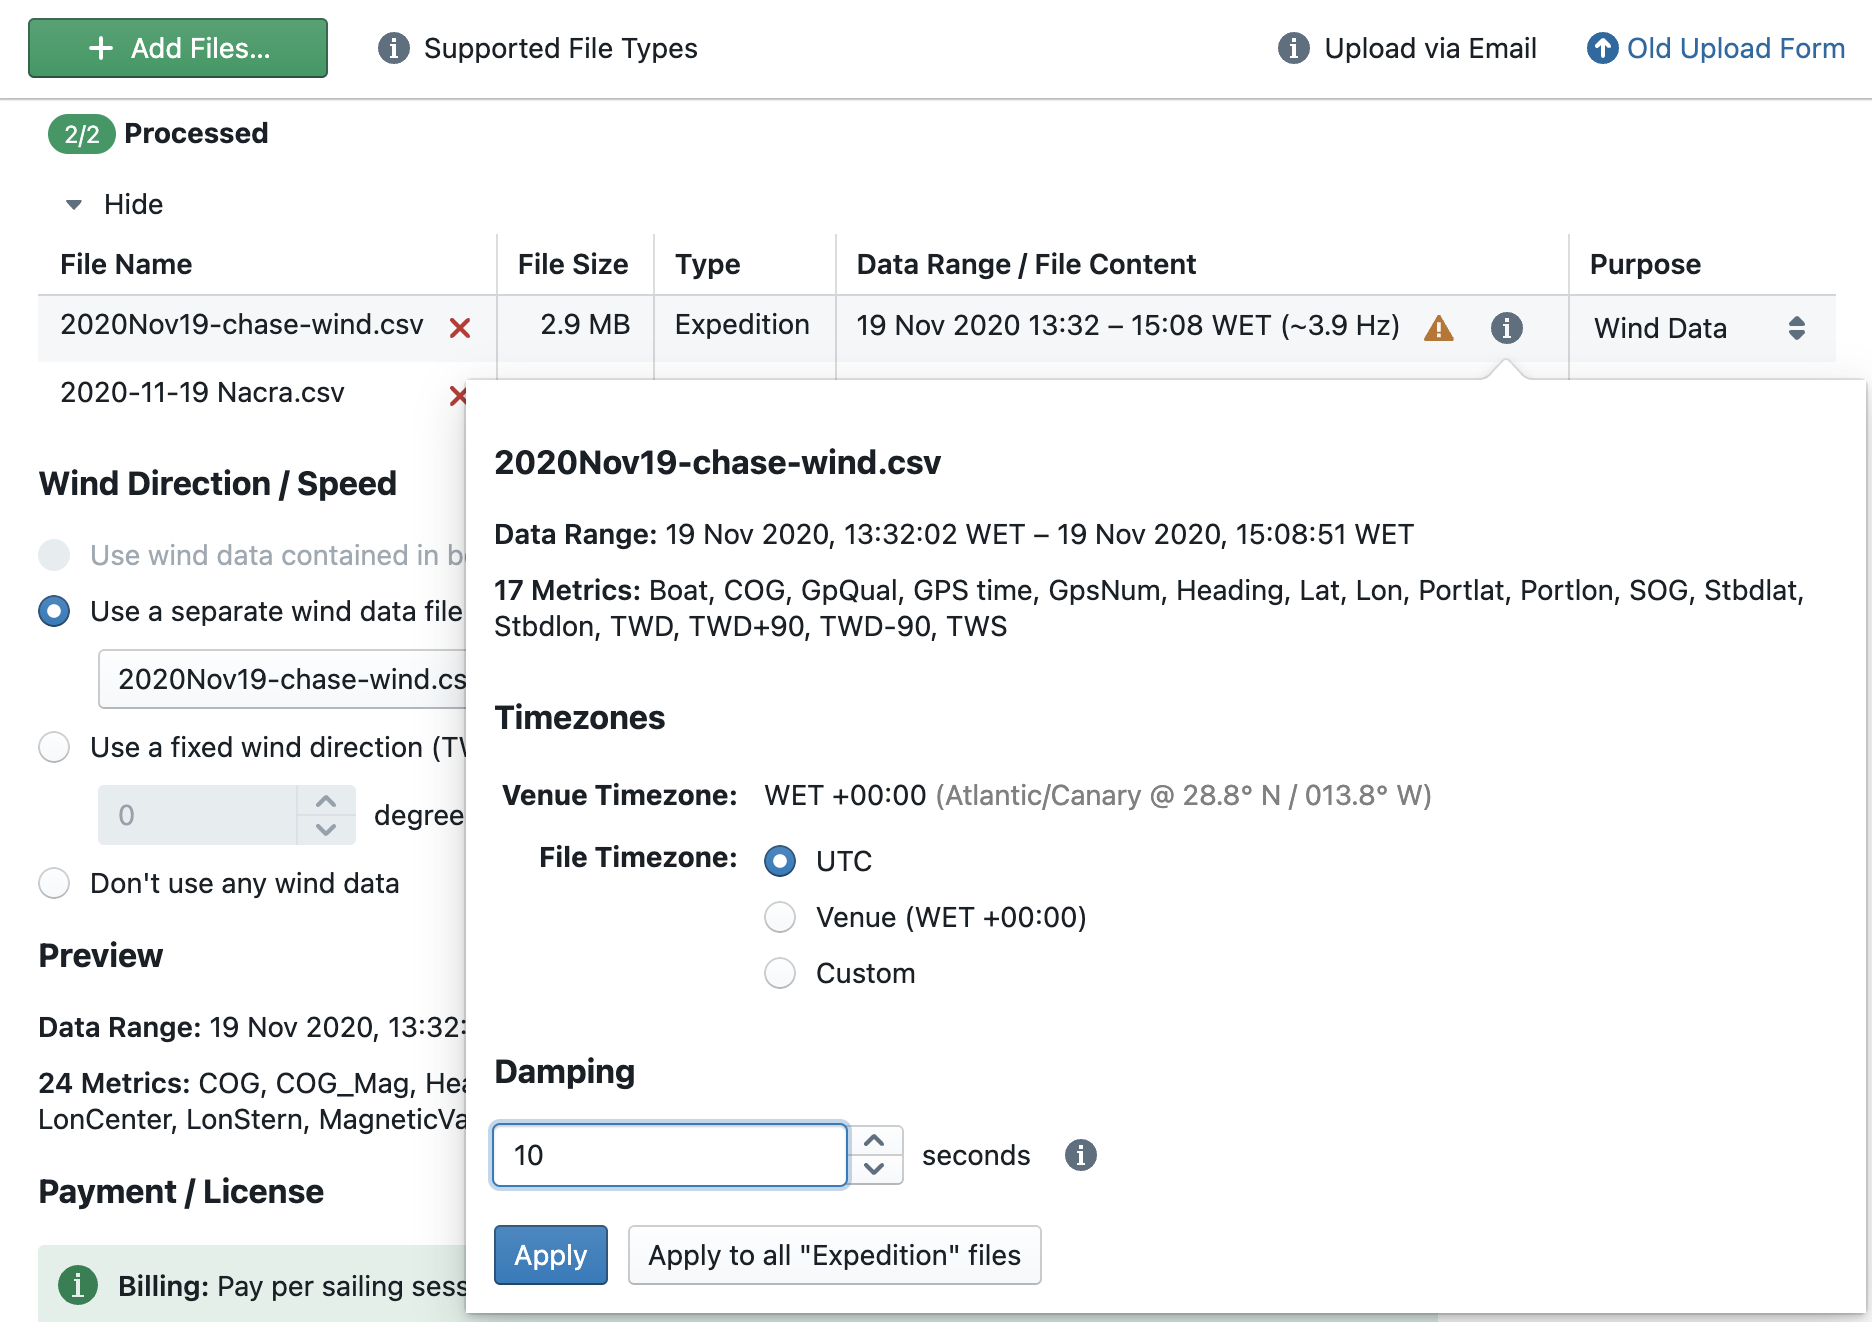
Is there a smoothing function for wind data? E.g. 5s, 10s, 15s, 30s averaging of wind coming from dinghy masts to remove noise?
When loading data and adding a wind data file (set file purpose: "Wind Data"), go to the file settings panel via the Info symbol in the uploaded files list. You can enter a custom amount of damping (in seconds) there.
My CSV file loads but the data looks wrong or metrics are missing
Check that your column headers match the standard Njord metric names listed in Metrics. Njord uses exact column names to assign meaning — for example, BoatSpeed (or BSP) is recognised as speed through water, while a column named Speed will load as an unnamed custom channel.
If a column name contains spaces or special characters, wrap it in double quotes in any formula that references it (e.g. "My Channel").
My CSV file has no absolute timestamps — can it still be used?
A CSV file with only relative timestamps (e.g. elapsed seconds) cannot be used as a standalone base file because Njord needs an absolute date and time to place the data on a timeline. However, it can be uploaded as Extra Data alongside a fully-timestamped base file. Set the File Purpose to Extra Data in the upload settings, and Njord will merge the two by aligning on their shared time range.
How do I upload two files for the same session (e.g. a log file and a heart rate monitor)?
Upload both files together in a single upload session and set the File Purpose for each:
- Set the main log file (GPS + speed data) to Base Data
- Set supplementary files (heart rate, extra sensors, wind, video overlays) to Extra Data or Wind Data as appropriate
Files uploaded separately to the same boat may not be automatically merged. When in doubt, upload them together.
My data file fails to load — what should I do?
Common causes:
- Latitude or longitude is zero or missing. Many data loggers write placeholder values of
0.0for position when GPS has no fix (e.g. immediately after power-on). Njord rejects records with zero or implausible coordinates. Wait for a GPS fix before starting your recording, or trim the file to remove the bad records. - Data logger restart mid-session. If a logger reboots mid-sail, the output file may reset its timestamp to the epoch or repeat time values. Split the file at the restart point and upload each part separately.
- Unsupported format. Check the list of supported data sources at www.sailnjord.com/data-sources. If your format is not listed, export to CSV and name the columns as described in Metrics.
I have a Vakaros — should I upload the .vkx file or the CSV export?
Upload the .vkx file directly. Njord has a native Vakaros parser that extracts all channels (including Heading) from the binary file. The CSV export from the Vakaros app omits Heading, which is needed for TWA and maneuver detection.
I use a Sailmon — how do I include the sail and maneuver events?
After your session, export both the log file and the events CSV from the Sailmon dashboard. Upload them together in one upload session, setting the events CSV File Purpose to Extra Data. Sail changes and events recorded on the water will then appear as annotations in Njord Analytics.
Overview
Njord Analytics is a web app — no installation required. Open app.sailnjord.com in any modern browser.
Typical first session
- Upload a log file — create a boat and event, then upload your log file. Races are detected automatically.
- Explore — click a race and open the Map, Line Chart, or Maneuvers view.
- Add wind data (if needed) — many features require true wind direction. See Adding Wind Data.
- Share with your team — invite teammates to the boat so they can access all data. See Sharing Boat Access.
Every log file you upload adds to your performance database automatically — no extra steps needed for season-long analysis.
Going further
- Trim Races — define race start/end times and course marks manually
- Visualizations — full list of available views
- Aggregate Analysis — compare data across multiple races and events
- Comparing Multiple Boats — get the most out of days when several boats sailed together
Upload Boat Data and First Analytics Steps
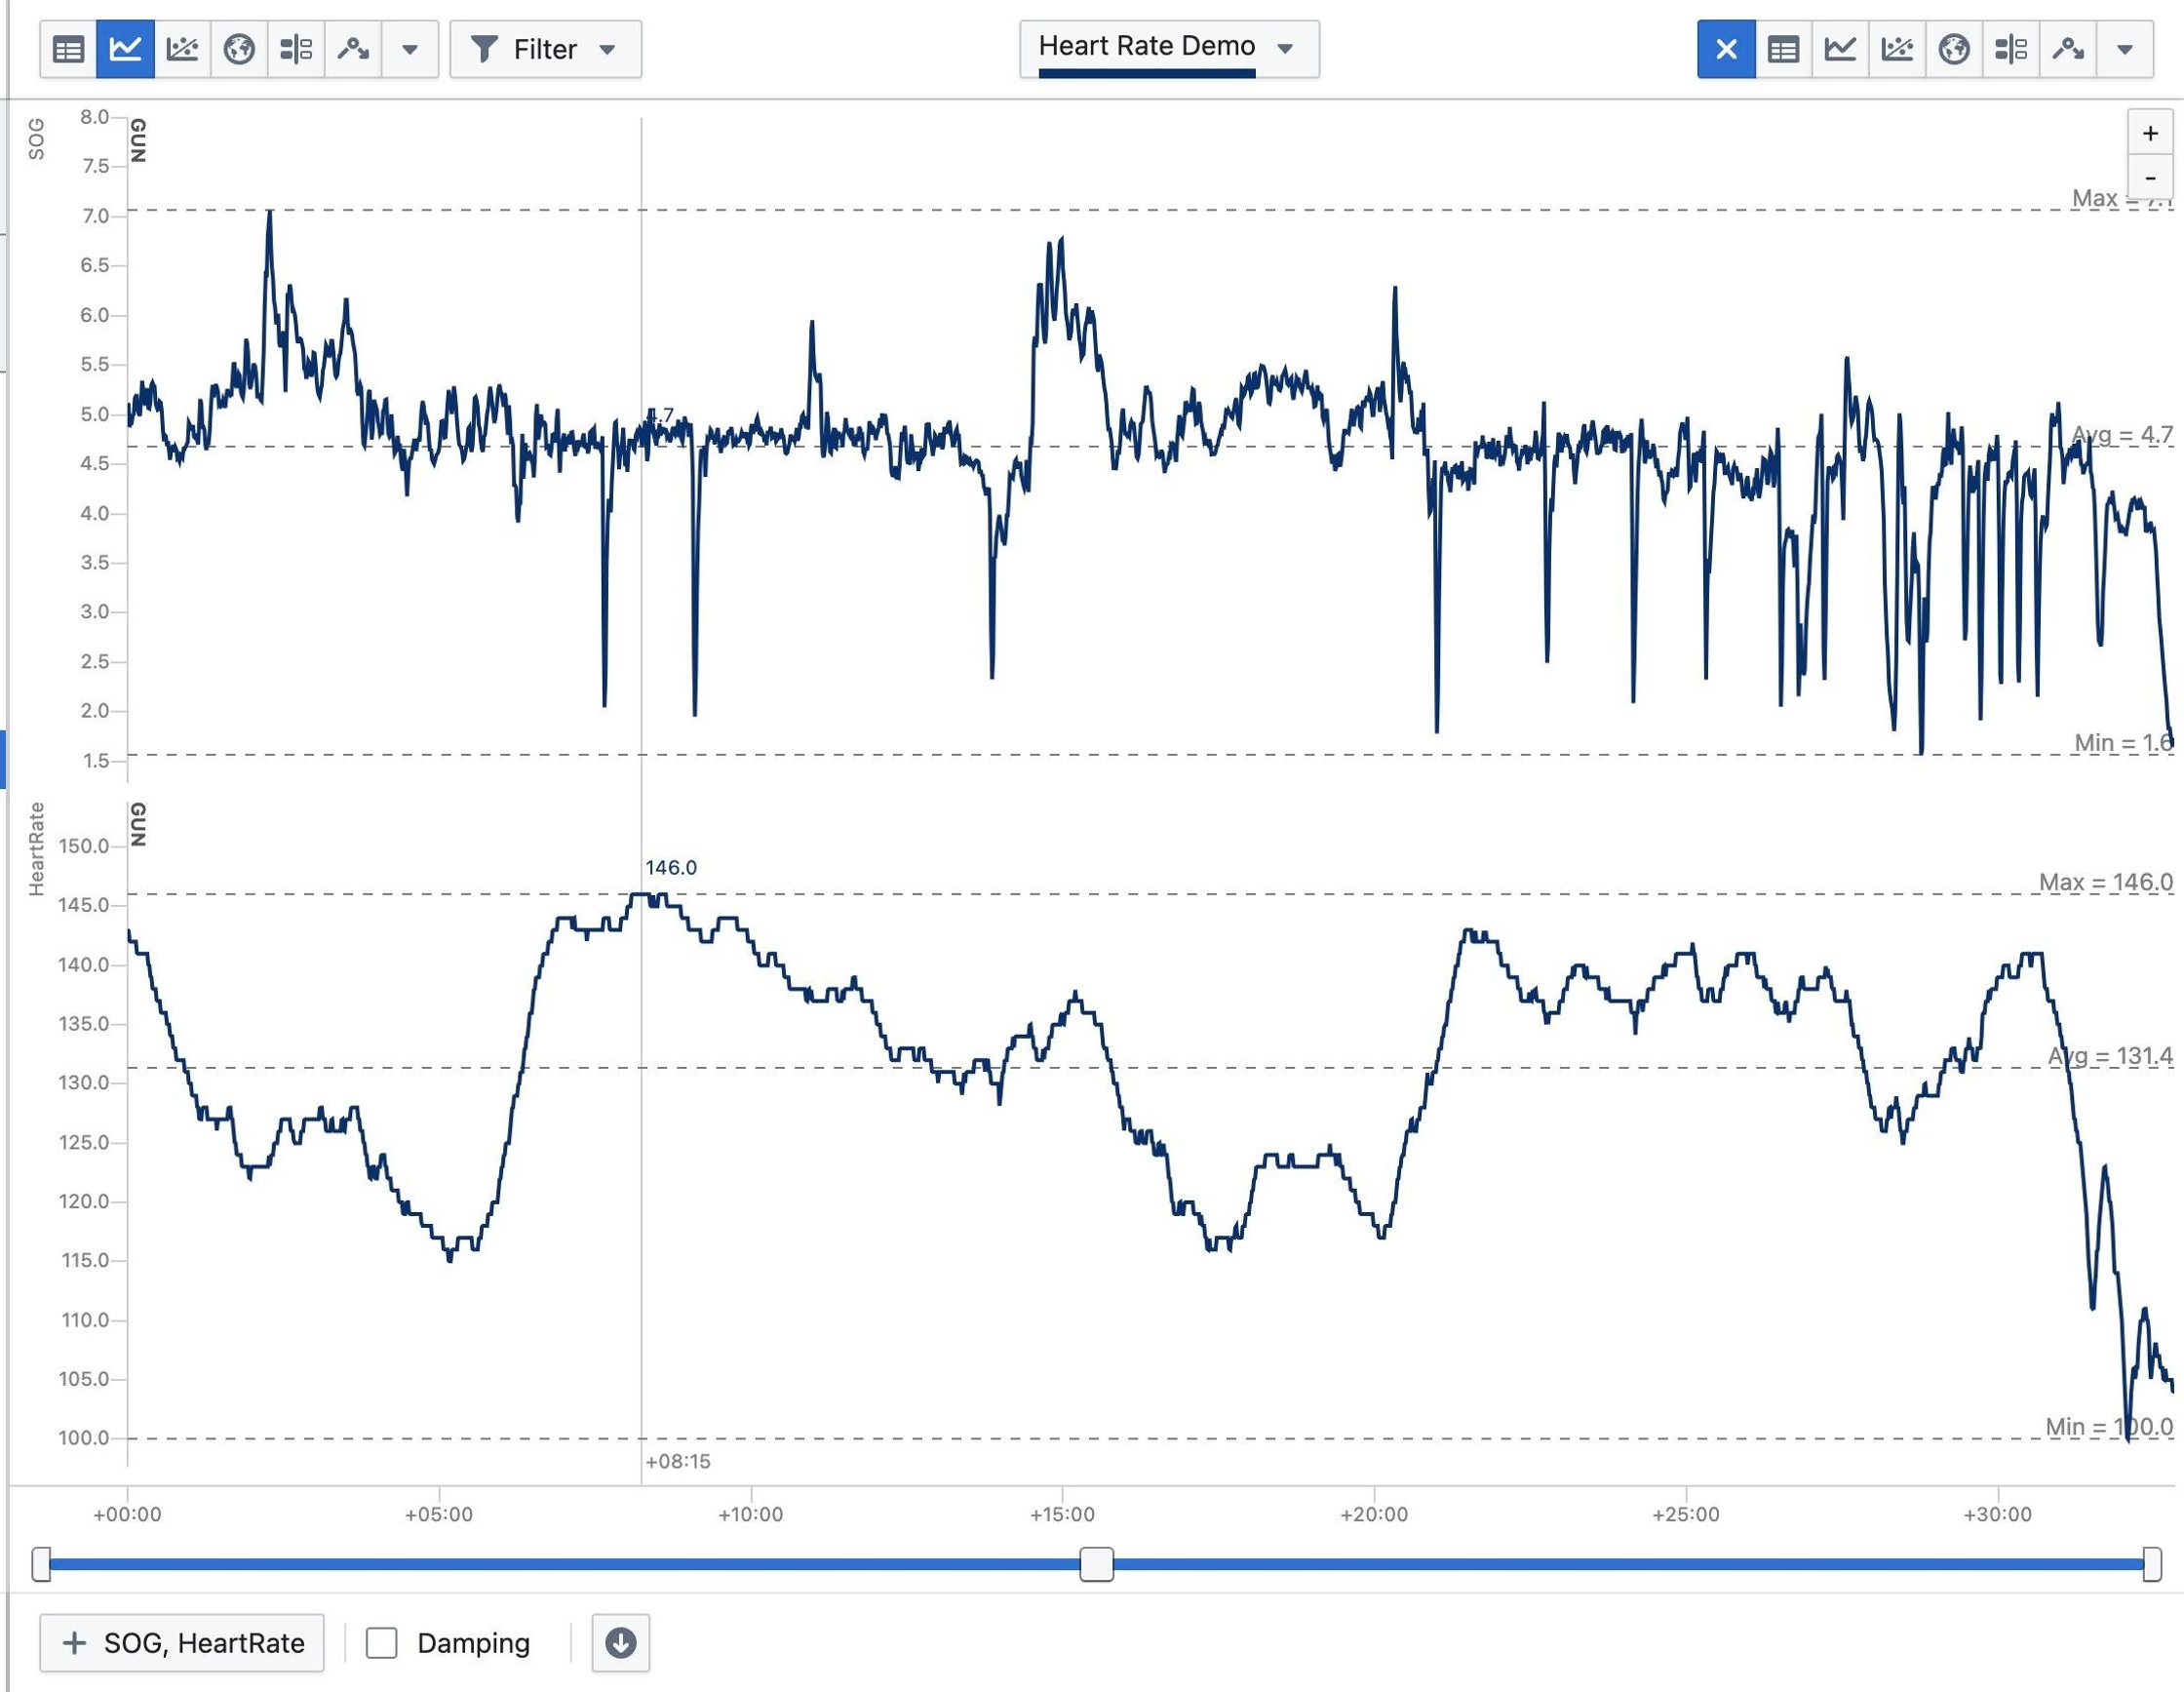
This tutorial shows how to upload a log file to Njord Analytics, and provides a first glance at some of the visualization options available.
Step 1
Navigate to https://app.sailnjord.com/
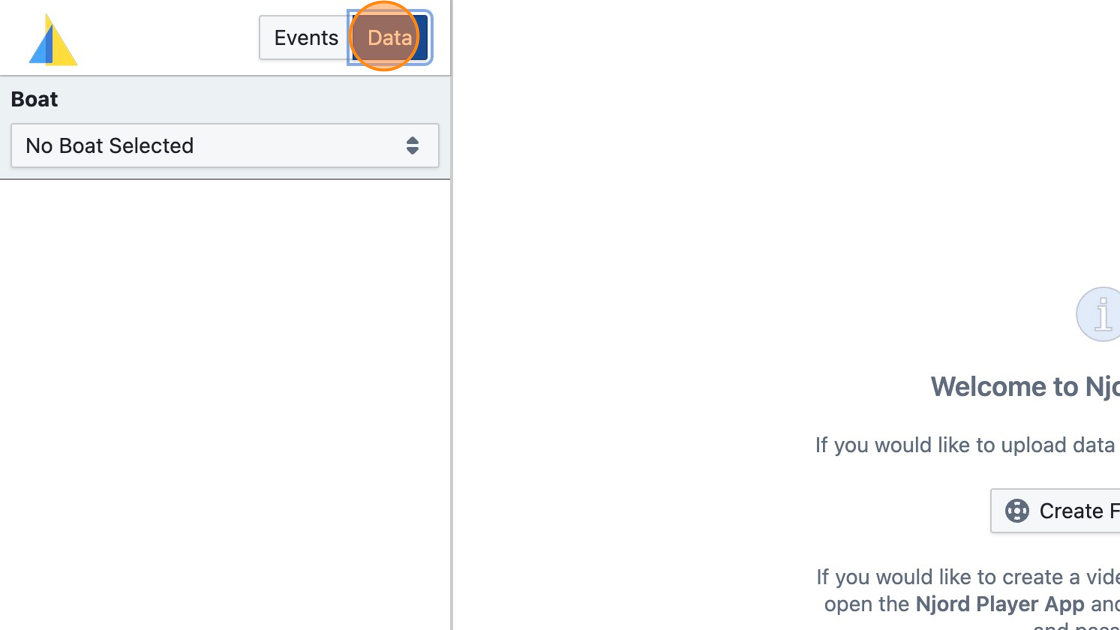
Step 2
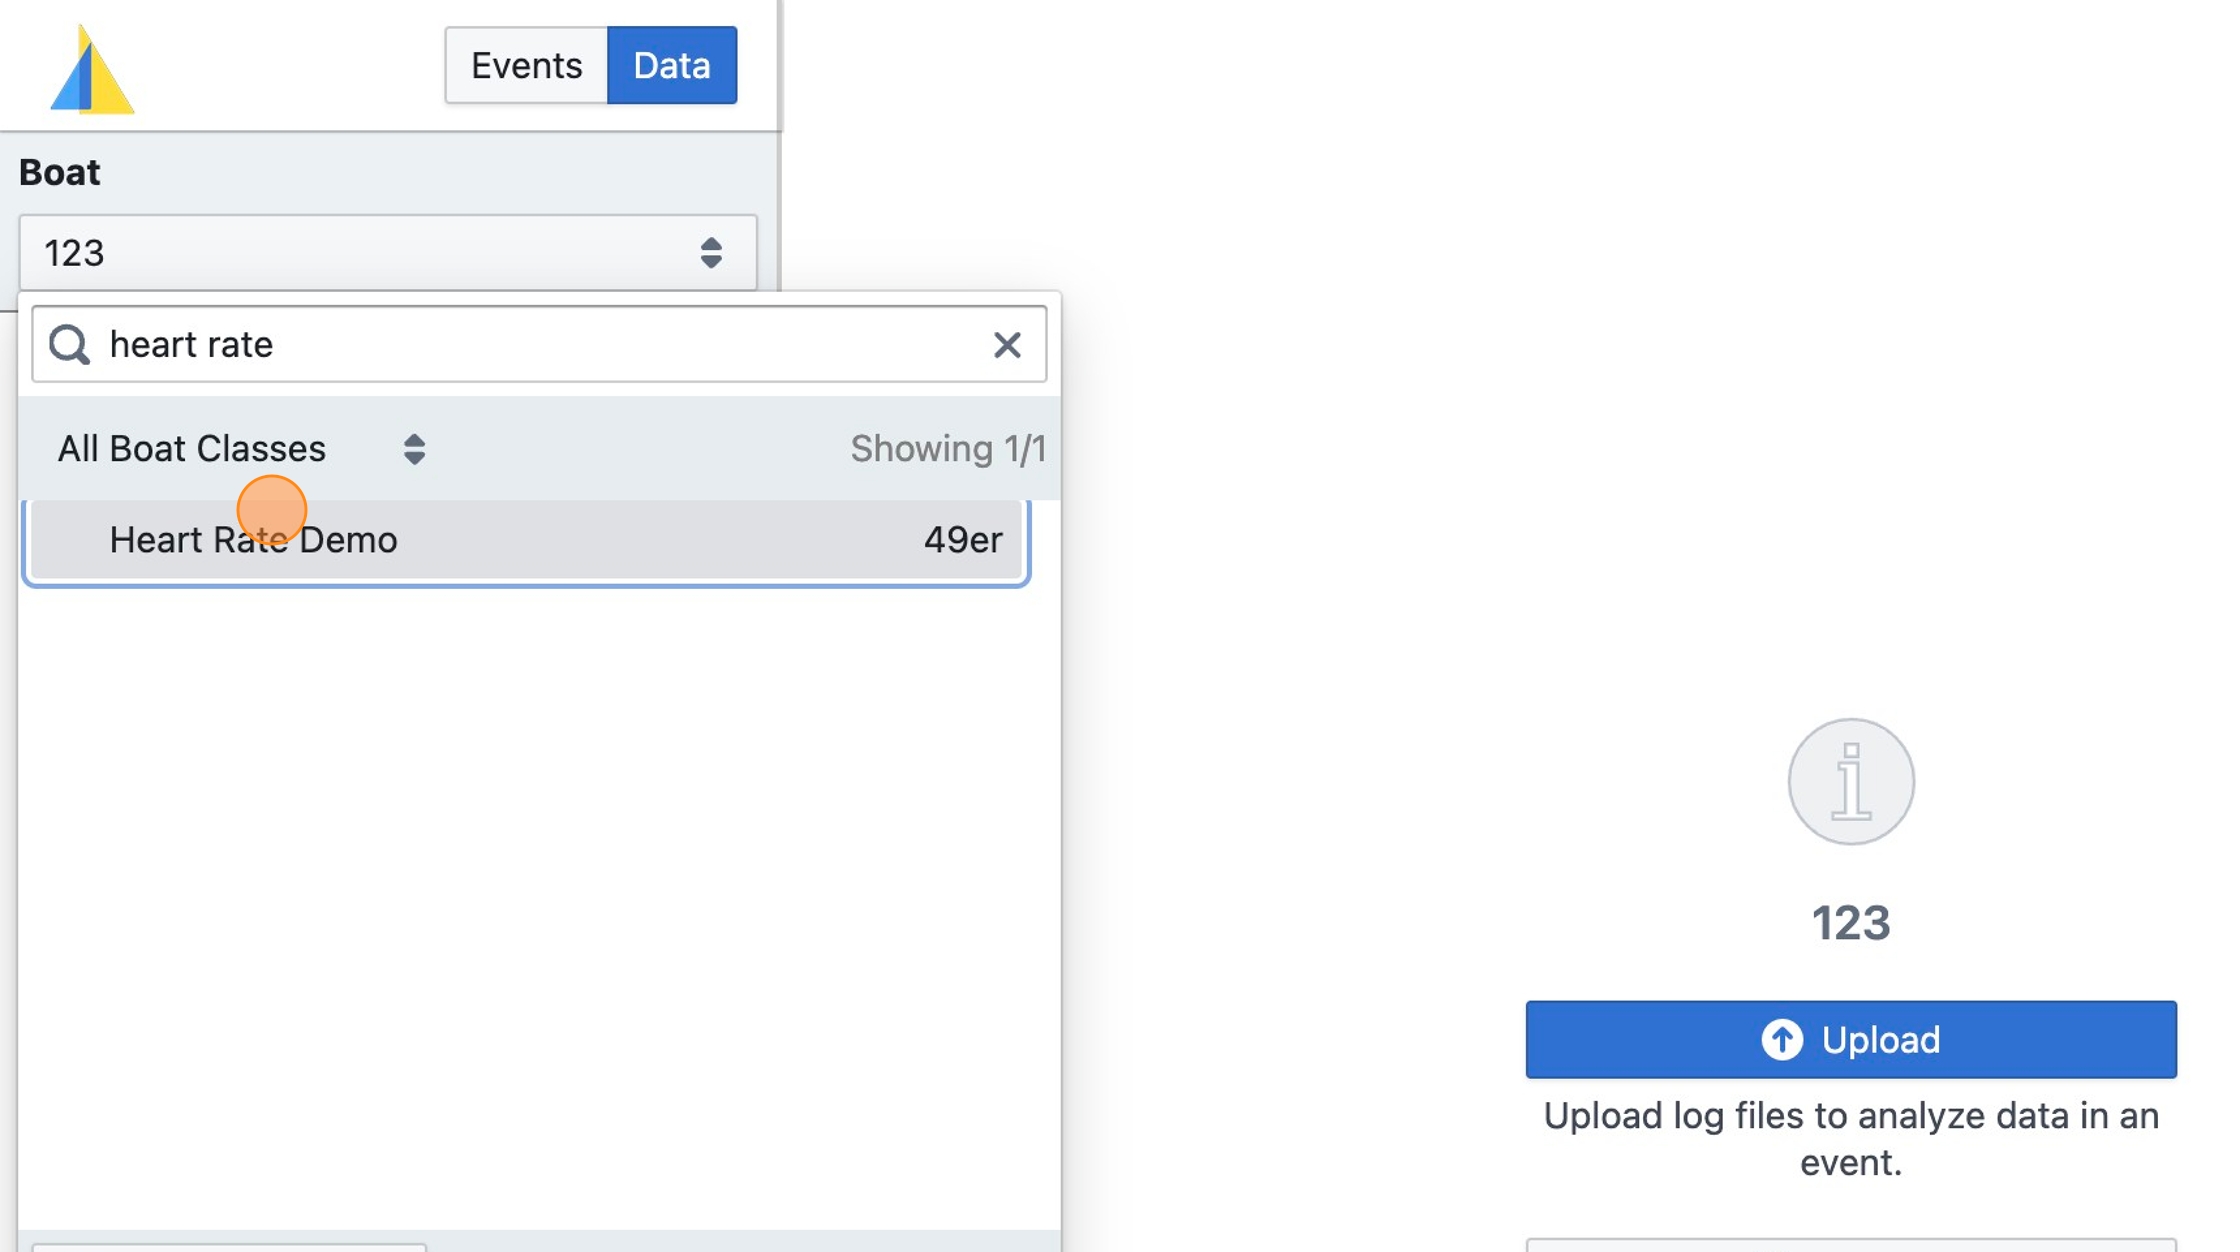
Click "Data"
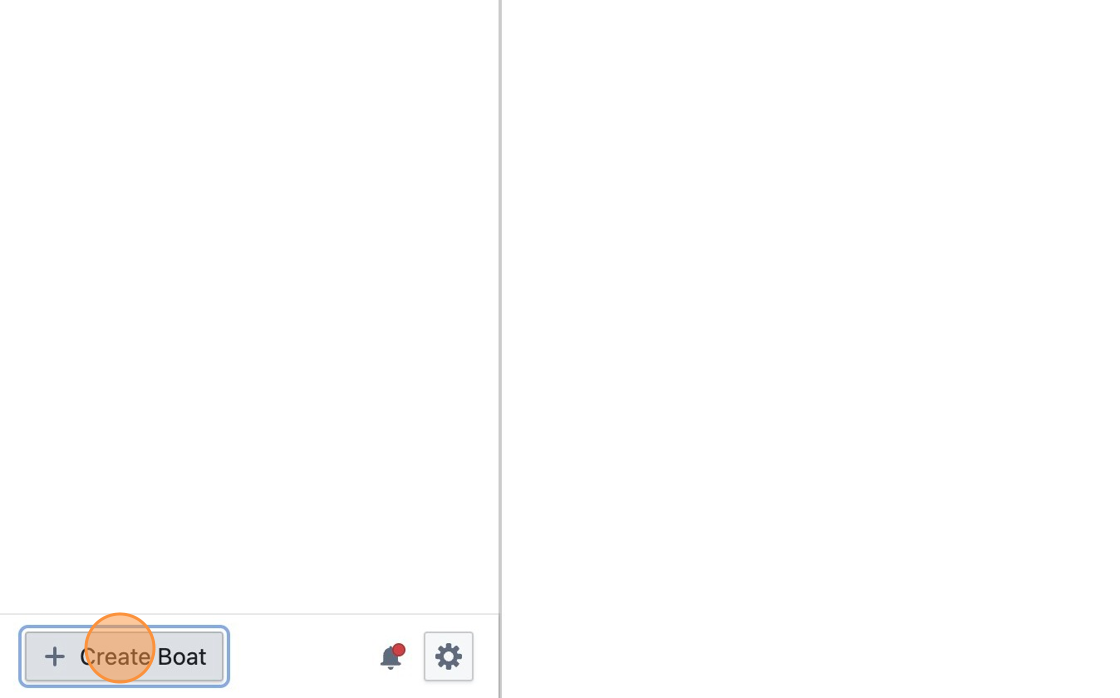
Step 3
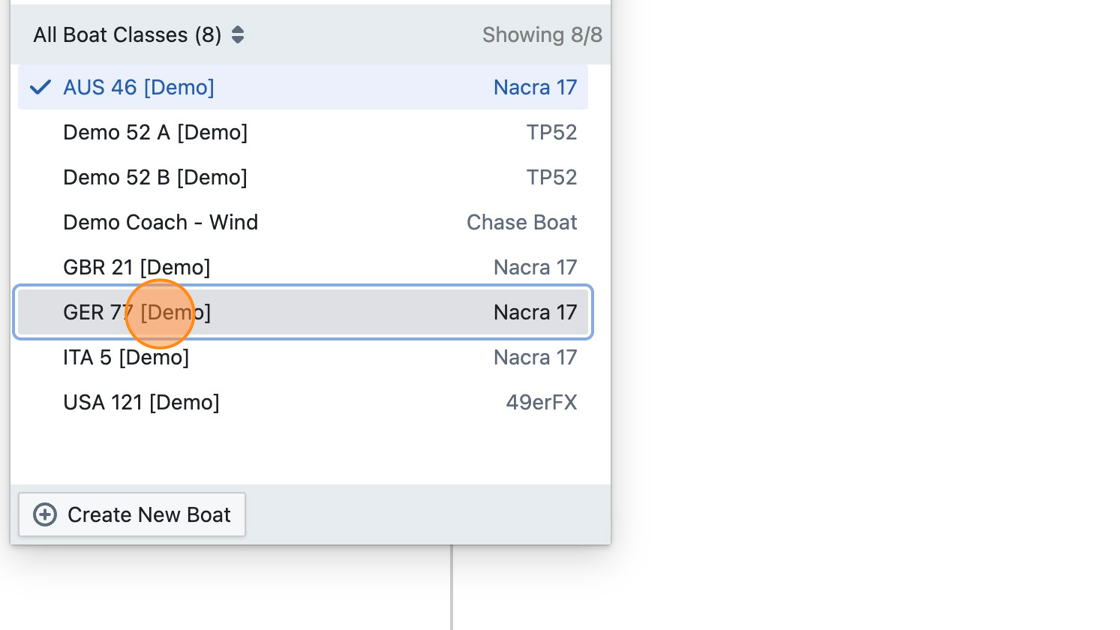
Click "Create Boat" if you haven't done this yet
Step 4
Enter the name of your boat and the boat class
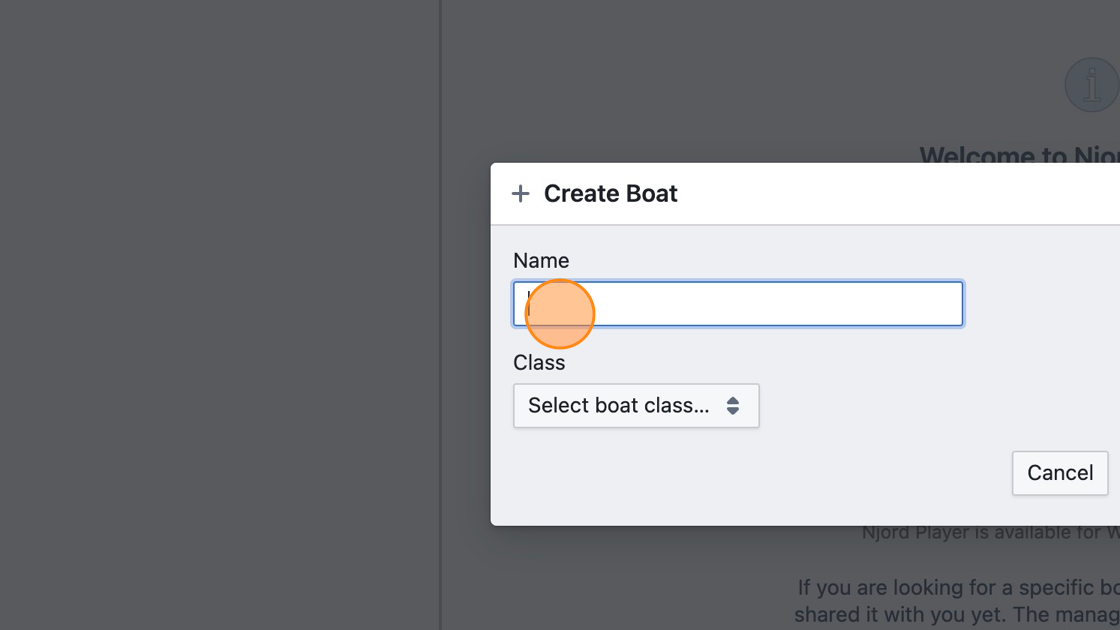
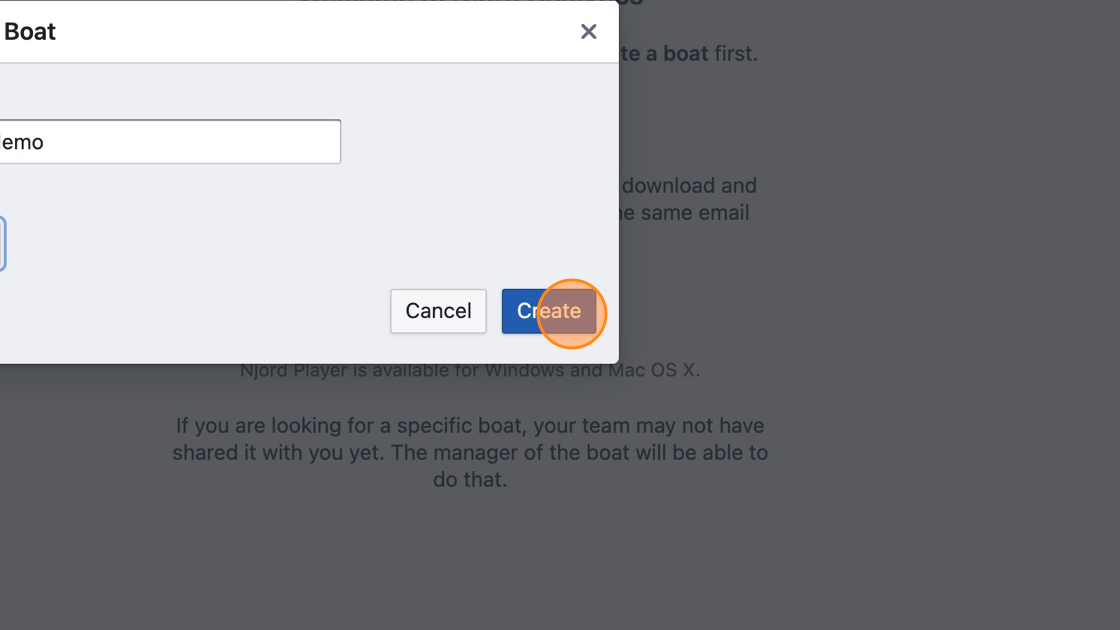
Step 5
Click "Create"
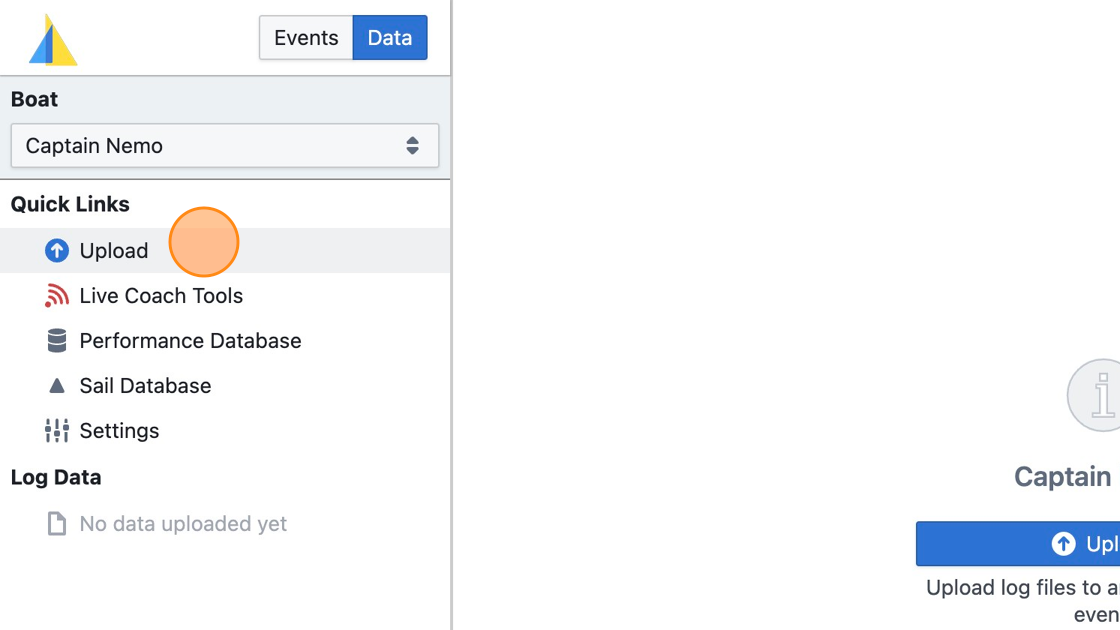
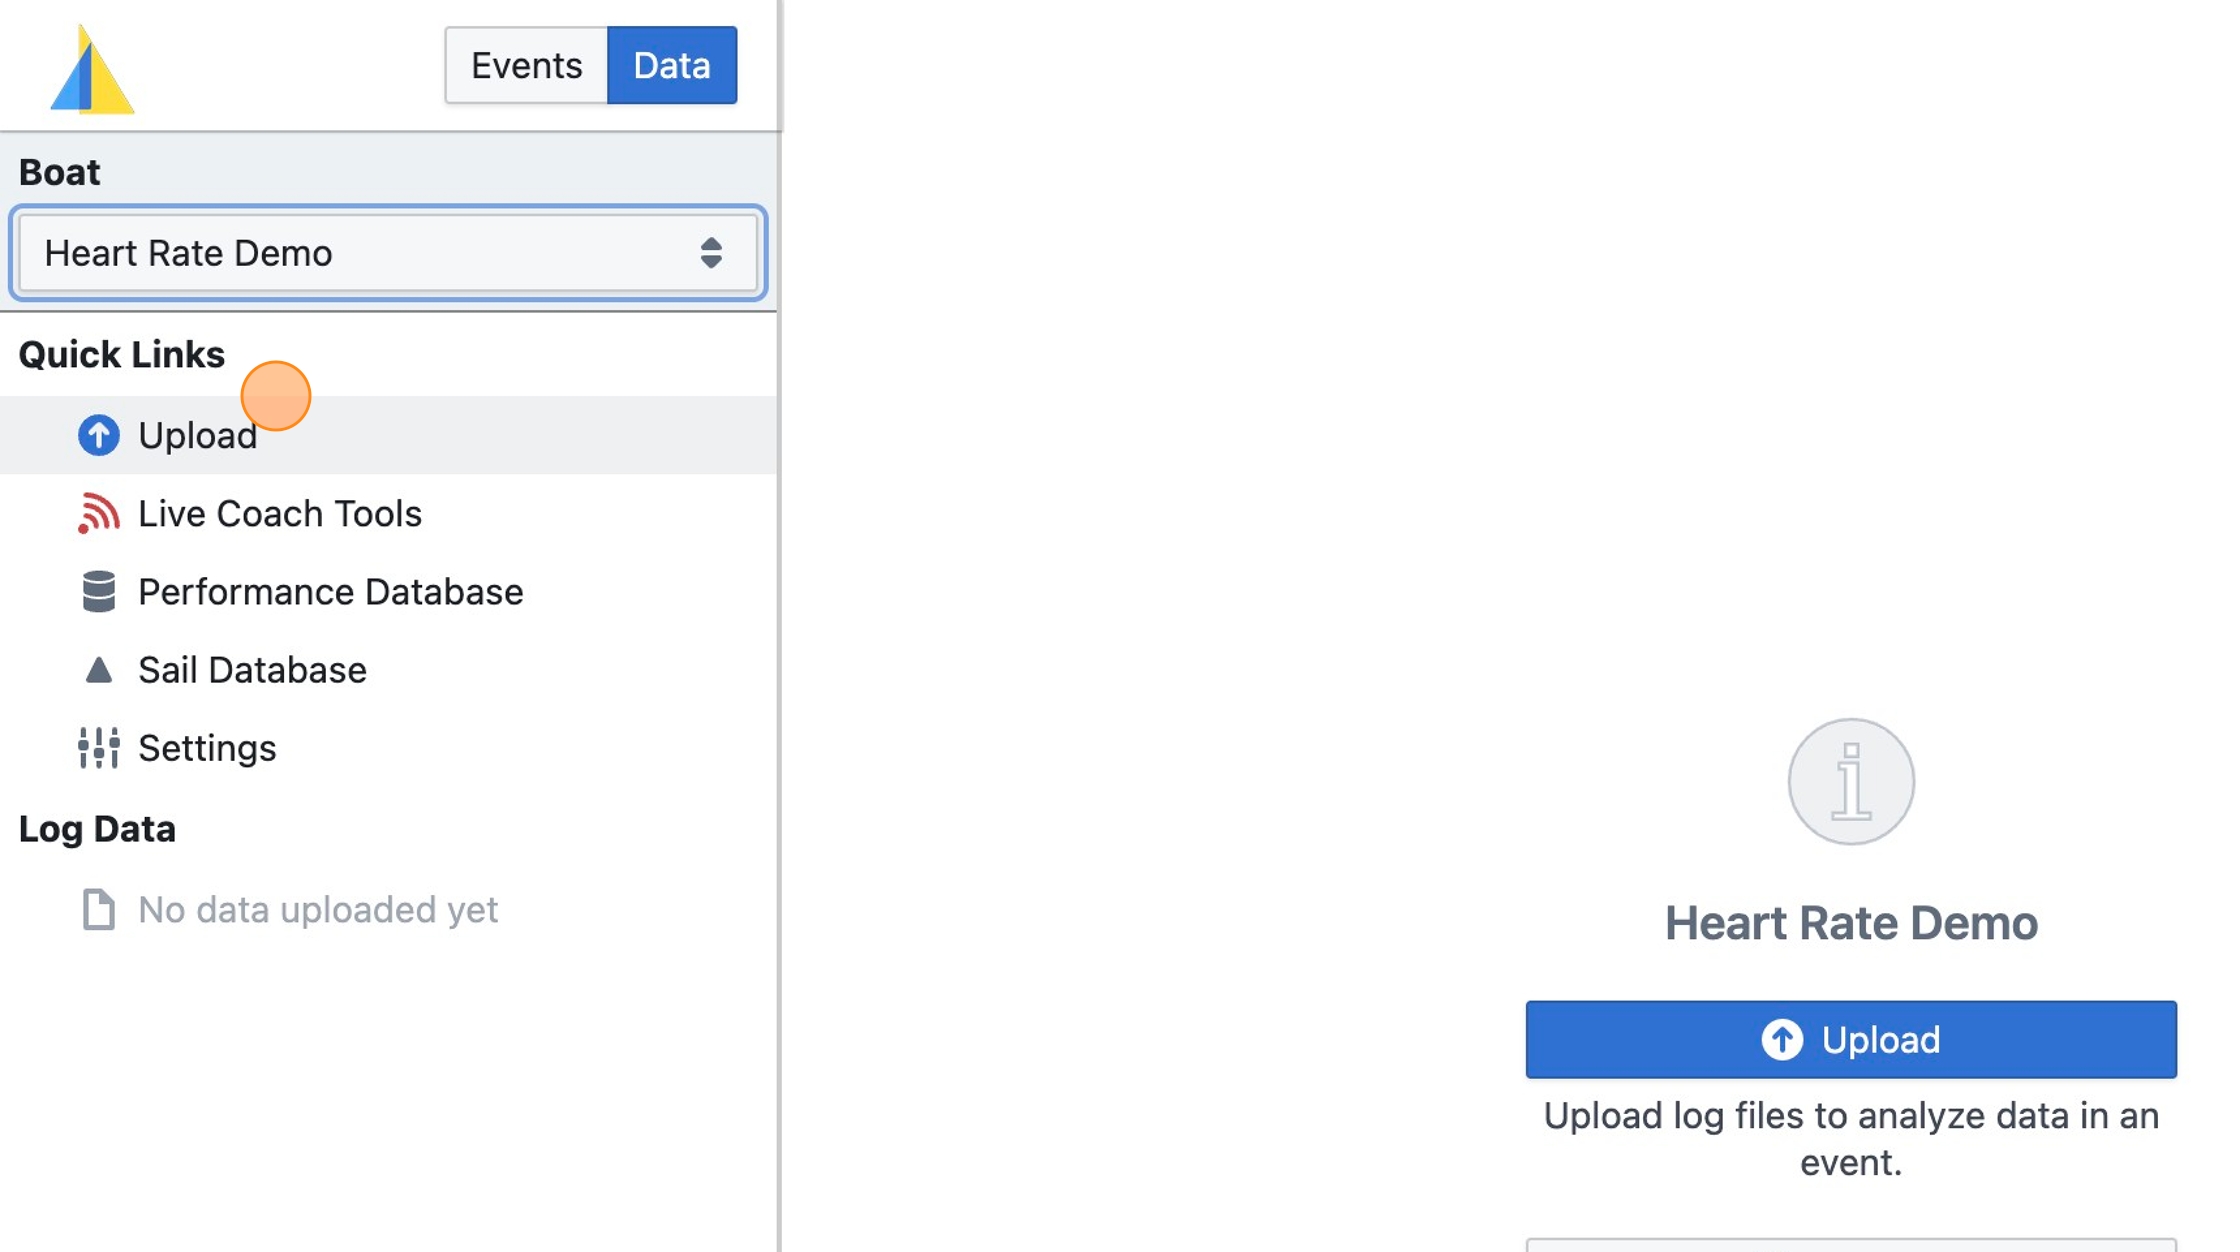
Step 6
Click "Upload"
Step 7
Click "Add Files…"
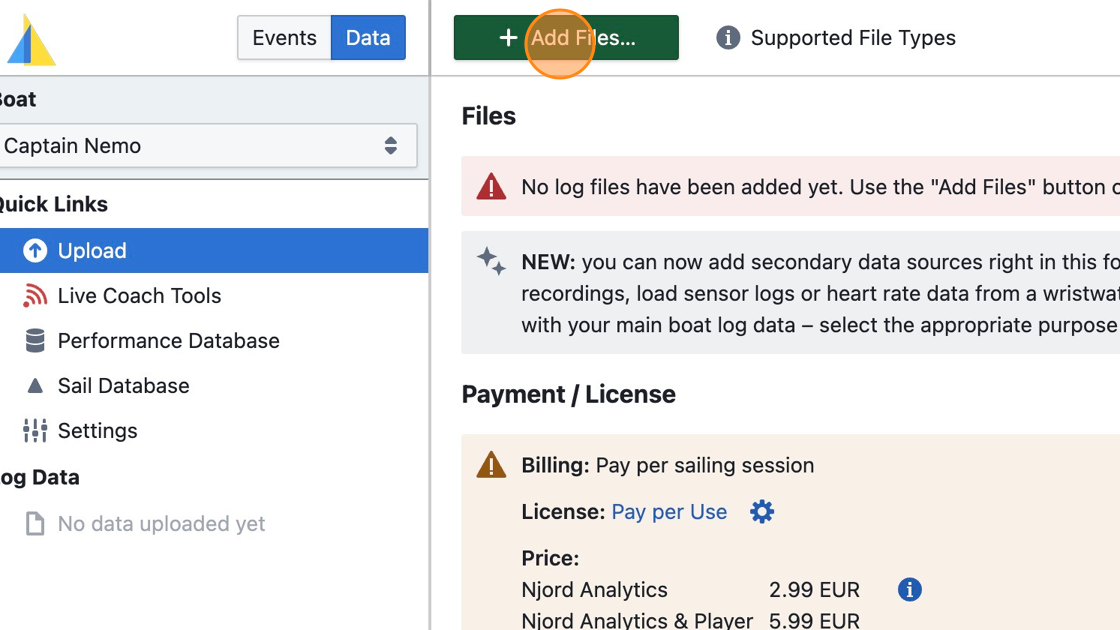
Tip: Learn more about supported data sources at https://www.sailnjord.com/data-sources/
Tip: To learn how to combine multiple data files, read Loading Heart Rate or Load Cell Data
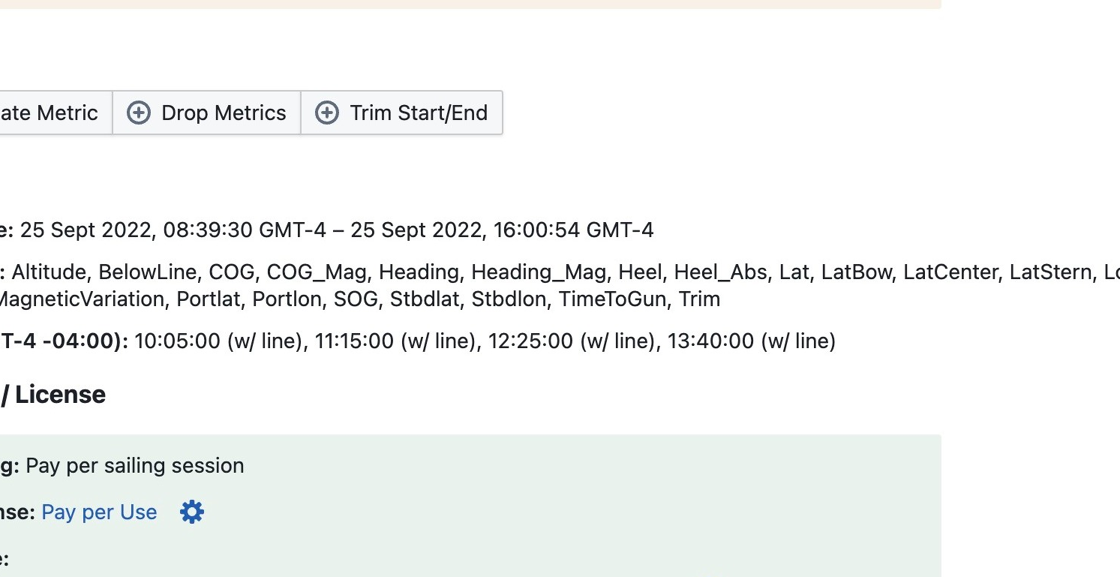
Step 8
Verify that the detected data time range matches what you expect
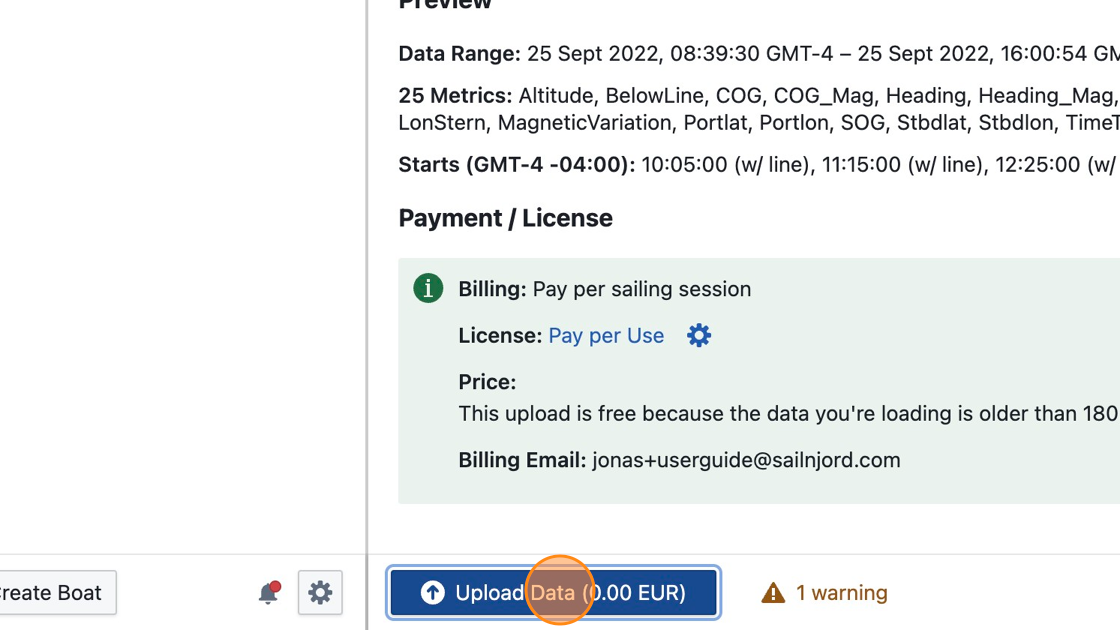
Step 9
Click "Upload Data" and wait for the data to be processed
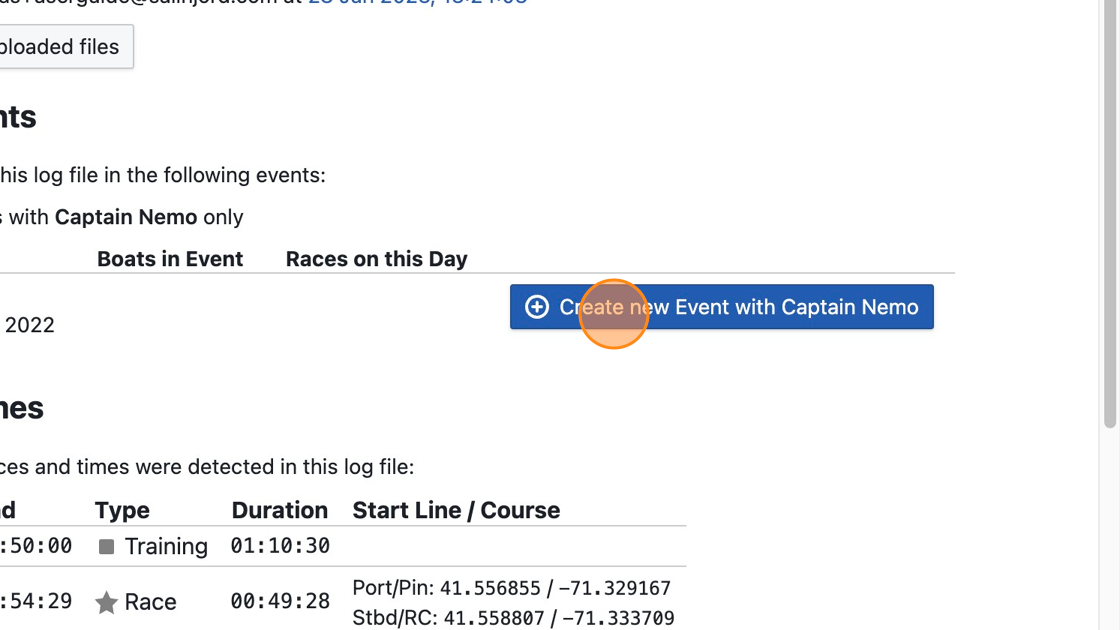
Step 10
Click "Create new Event with Your Boat"
Step 11
Enter a name for the event and adjust the start/end date if necessary
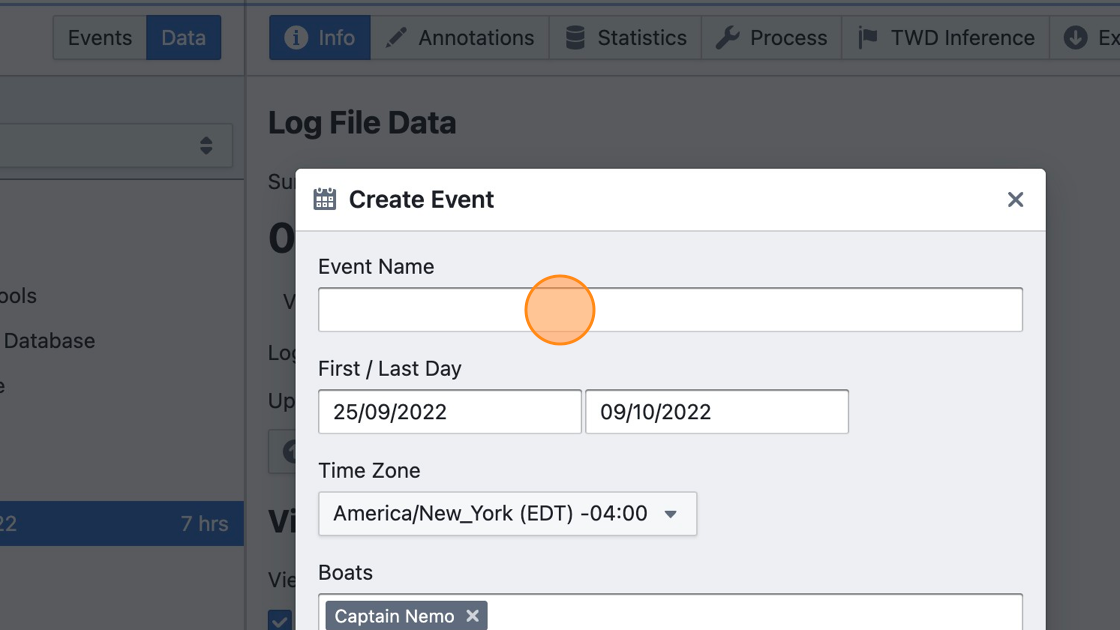
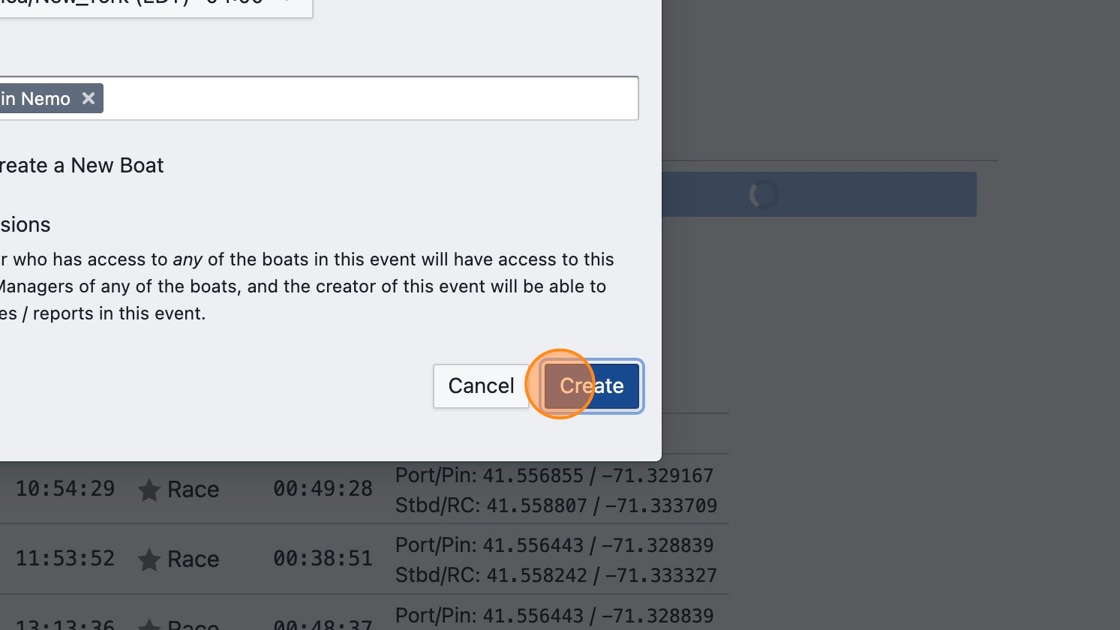
Step 12
Click "Create"
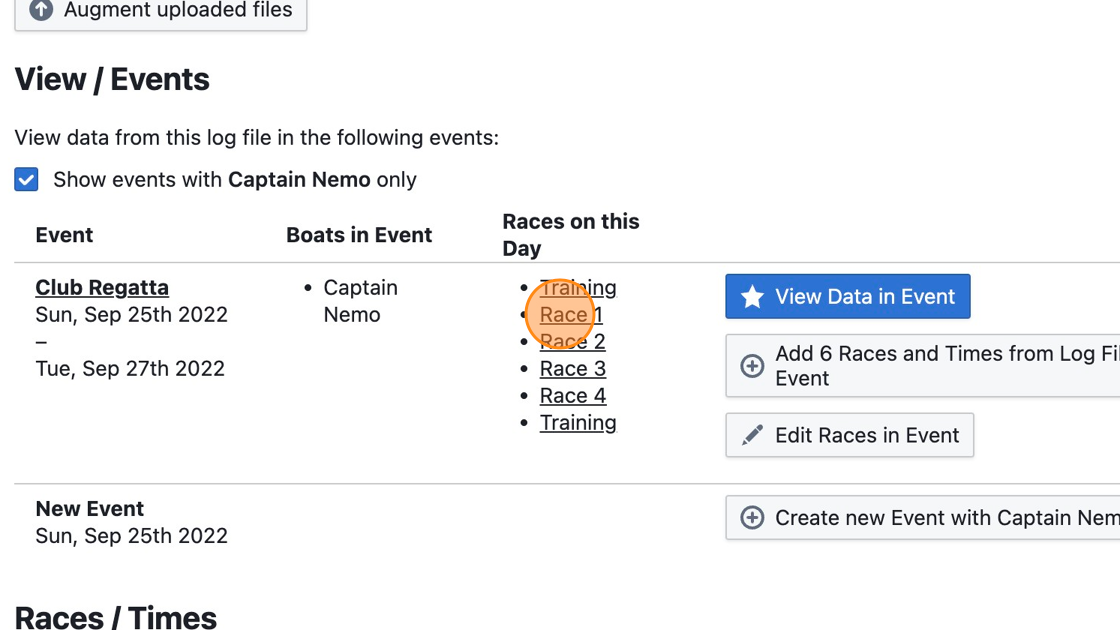
Step 13
Training and Race times will be copied to the new event automatically. Click on "Race 1" or "Training" to view the uploaded data.
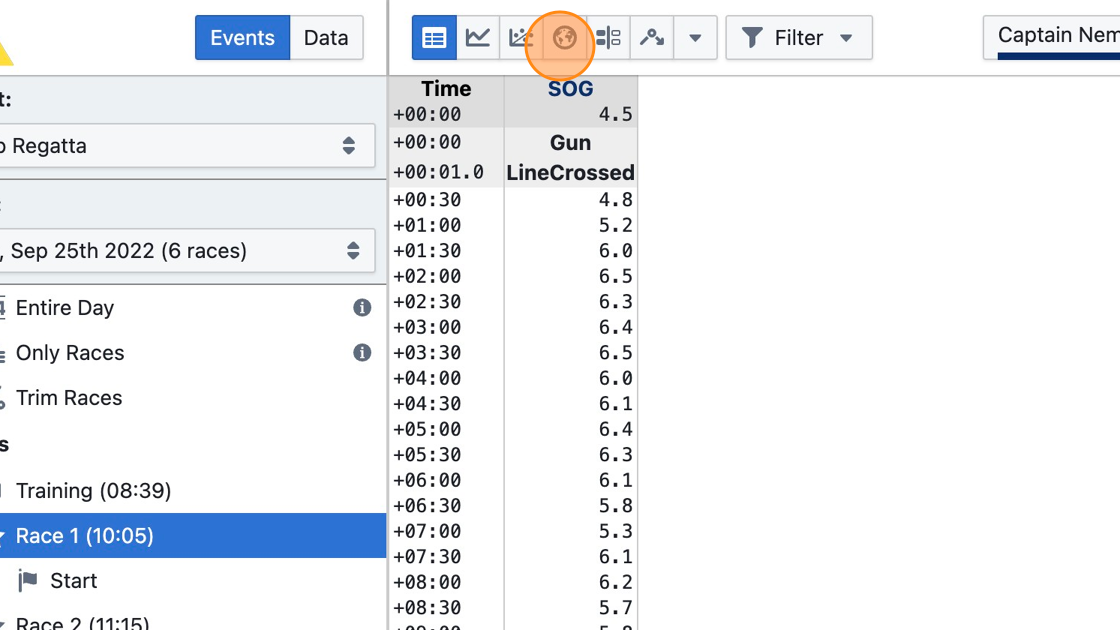
Step 14
Choose from the available visualizations, such as the map view
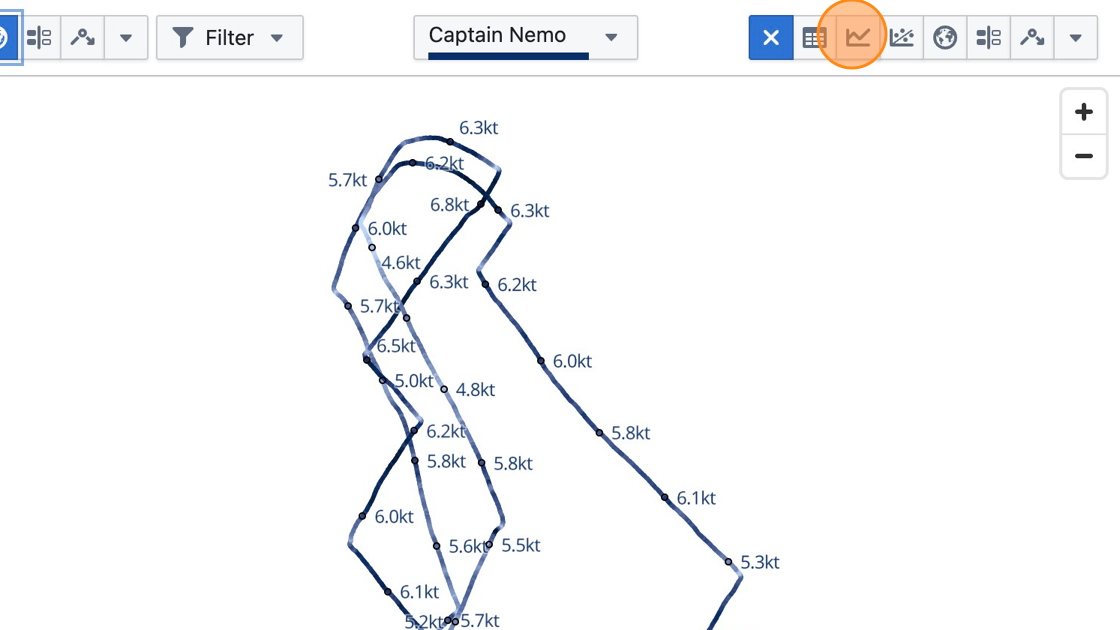
Step 15
Choose a second view type to show side by side
Step 16
To highlight a range of data, click on the track of the boat (this also works in the line chart, for example)
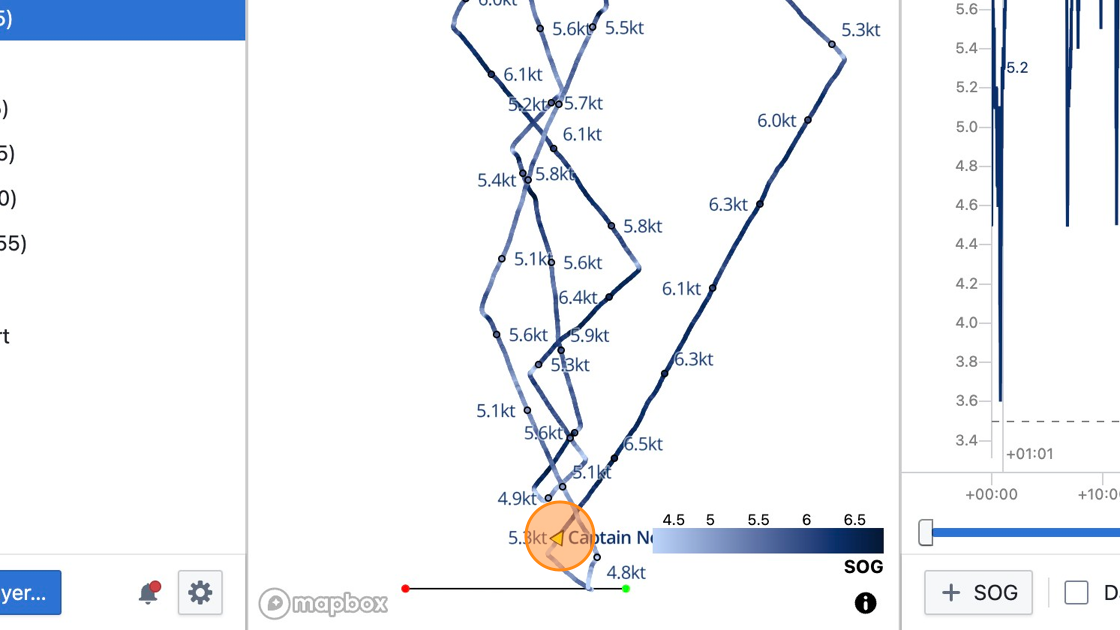
Step 17
Click again to mark the end of the highlighted time range
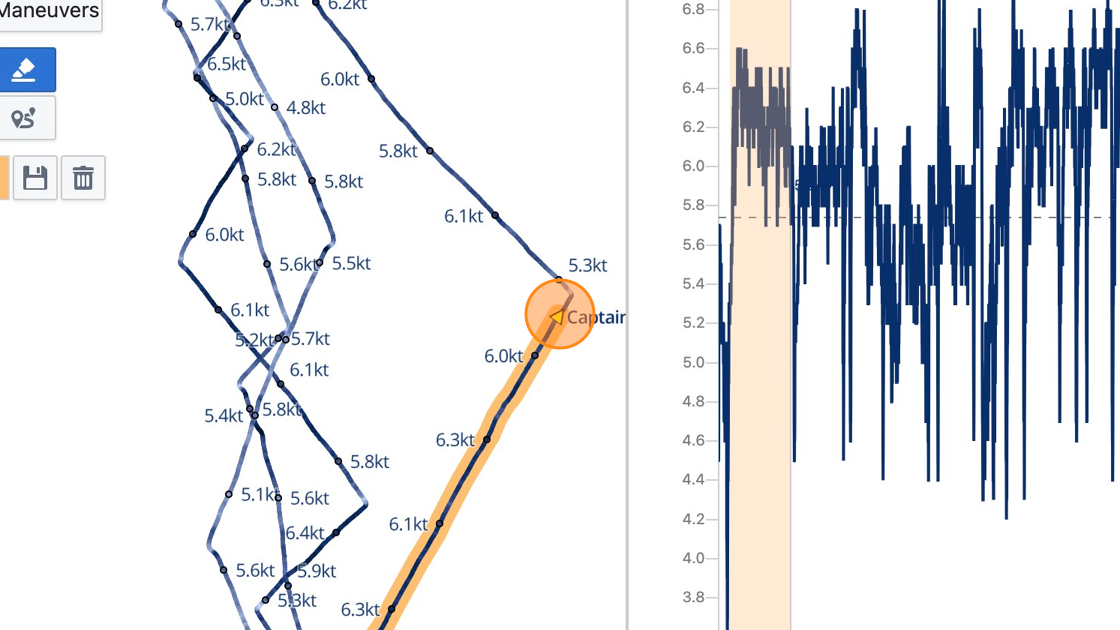
Step 18
Repeat as necessary to highlight more time ranges
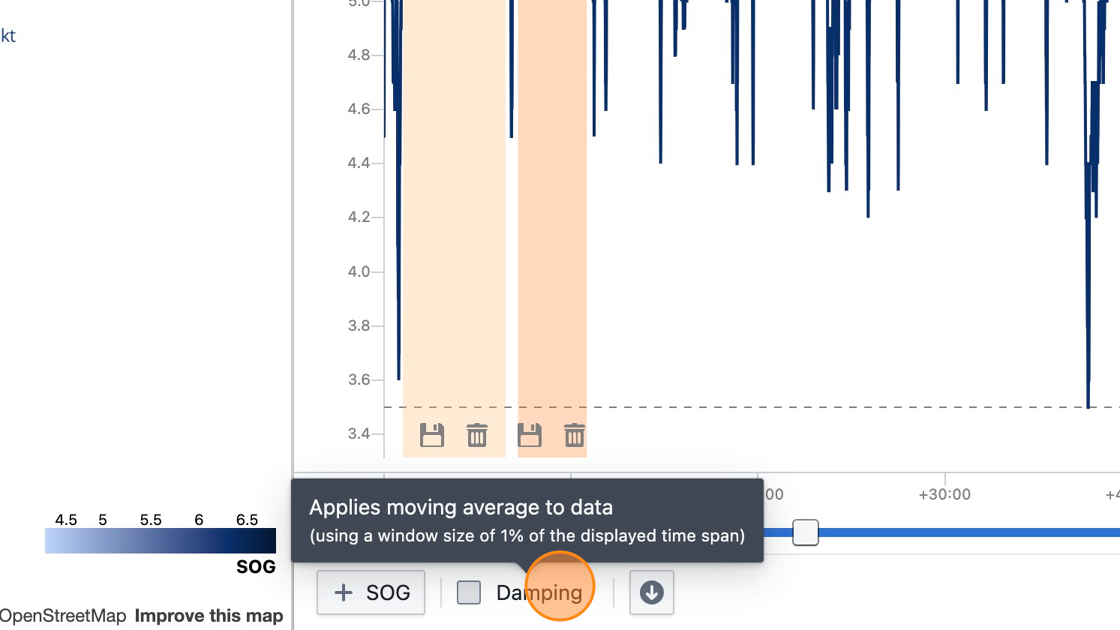
Step 19
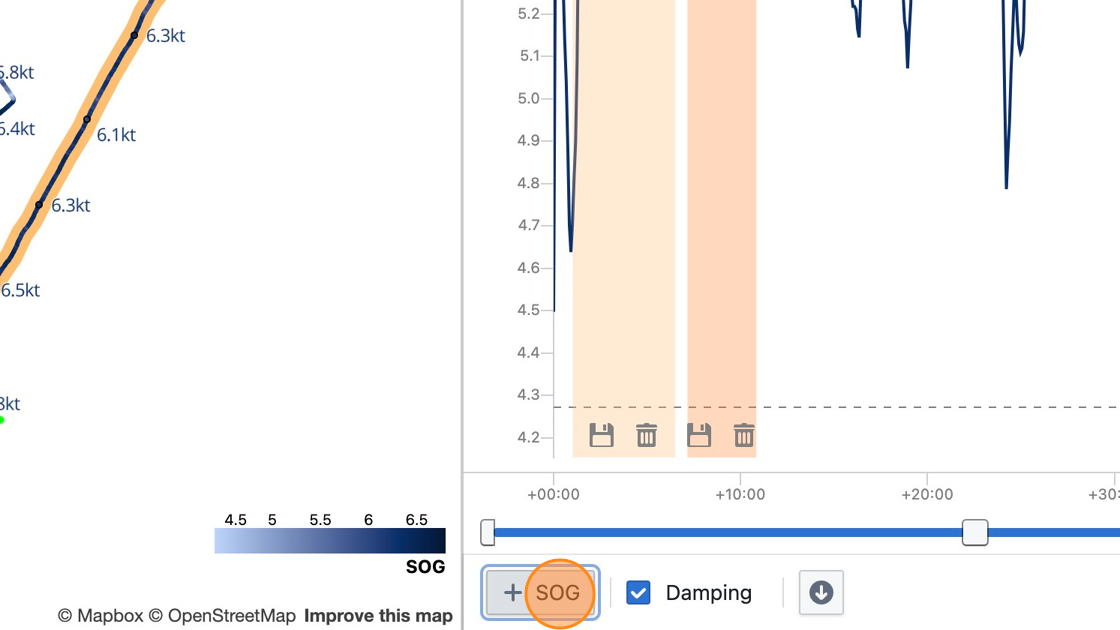
Click "Damping" to enable damping
Step 20
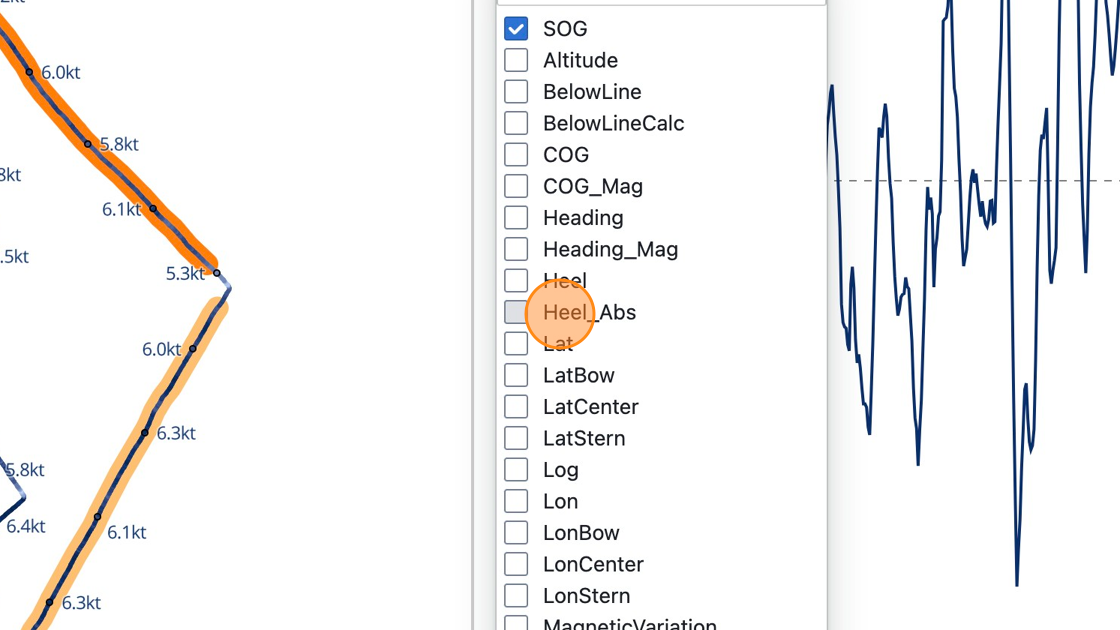
Click the plus button to add more variables
Step 21
Select a variable you'd like to add to the line chart
Step 22
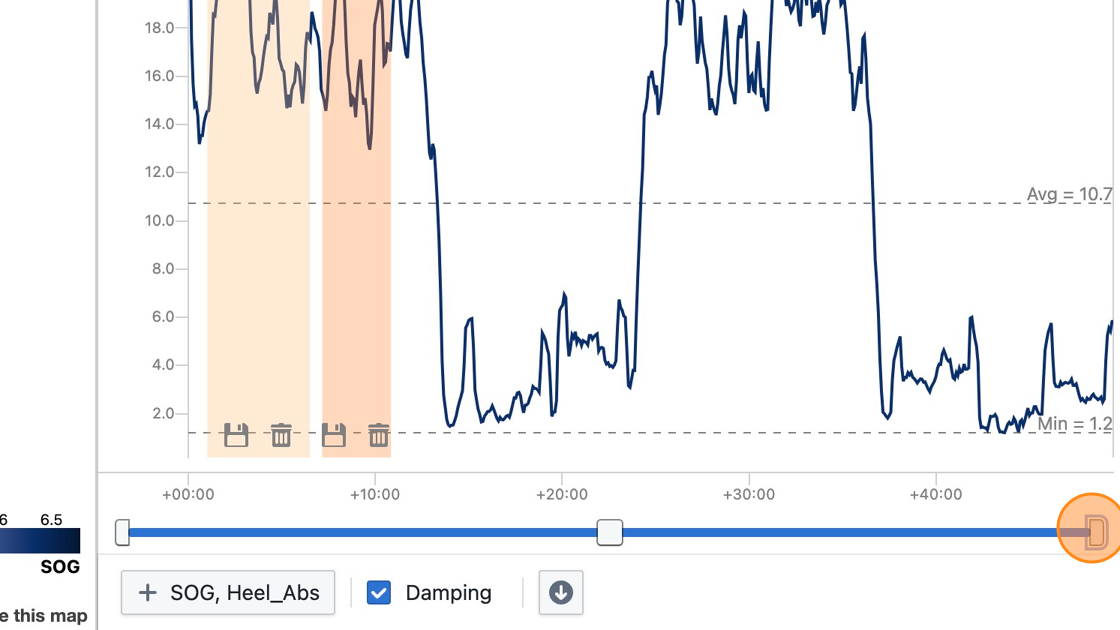
Click and drag the handle to zoom into the line chart
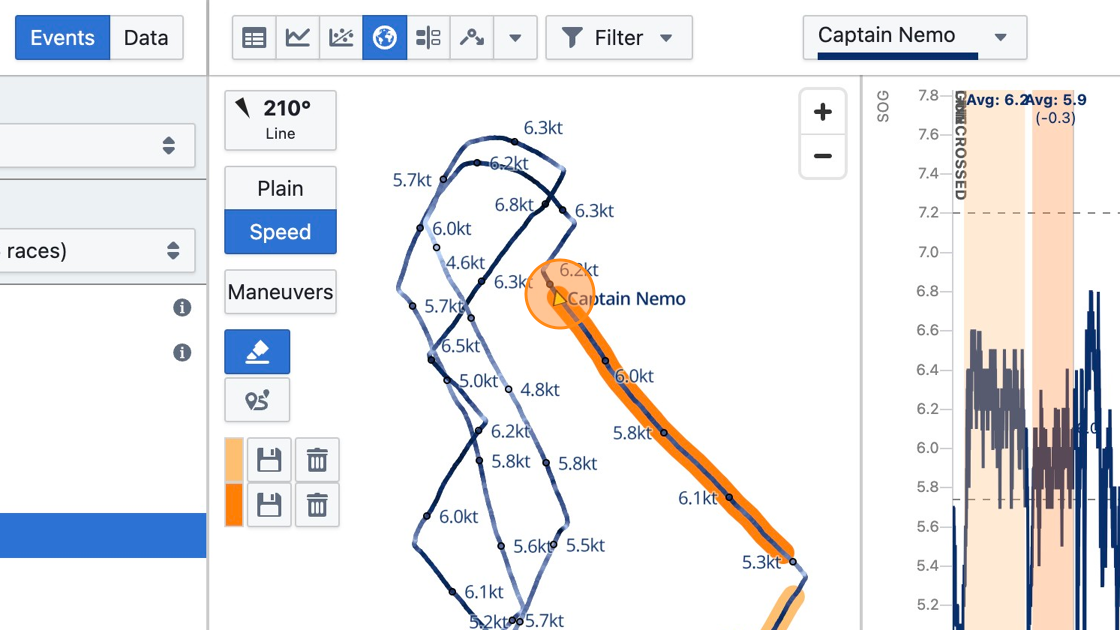
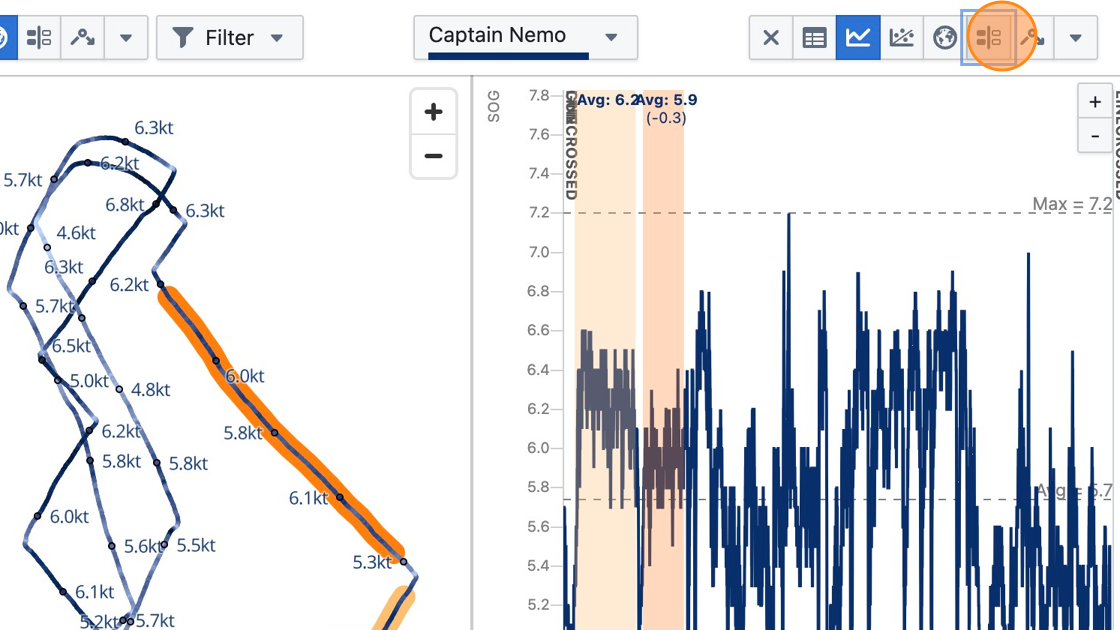
Step 23
Select the "Statistics" view to see detailed stats for the highlighted time ranges
Step 24
Statistics shown include average, minimum and maximum values. Click "Settings" to show more variables.
Tip: Learn more about available visualization types at https://app.sailnjord.com/help/analytics/visualizations.html
Creating and Trimming Races
This tutorial shows how to create a race on the timeline, adjust start and end times, and add a race course to help focus the analysis on relevant parts of the day.
Step 1
Navigate to https://app.sailnjord.com/events/ or click "Events"
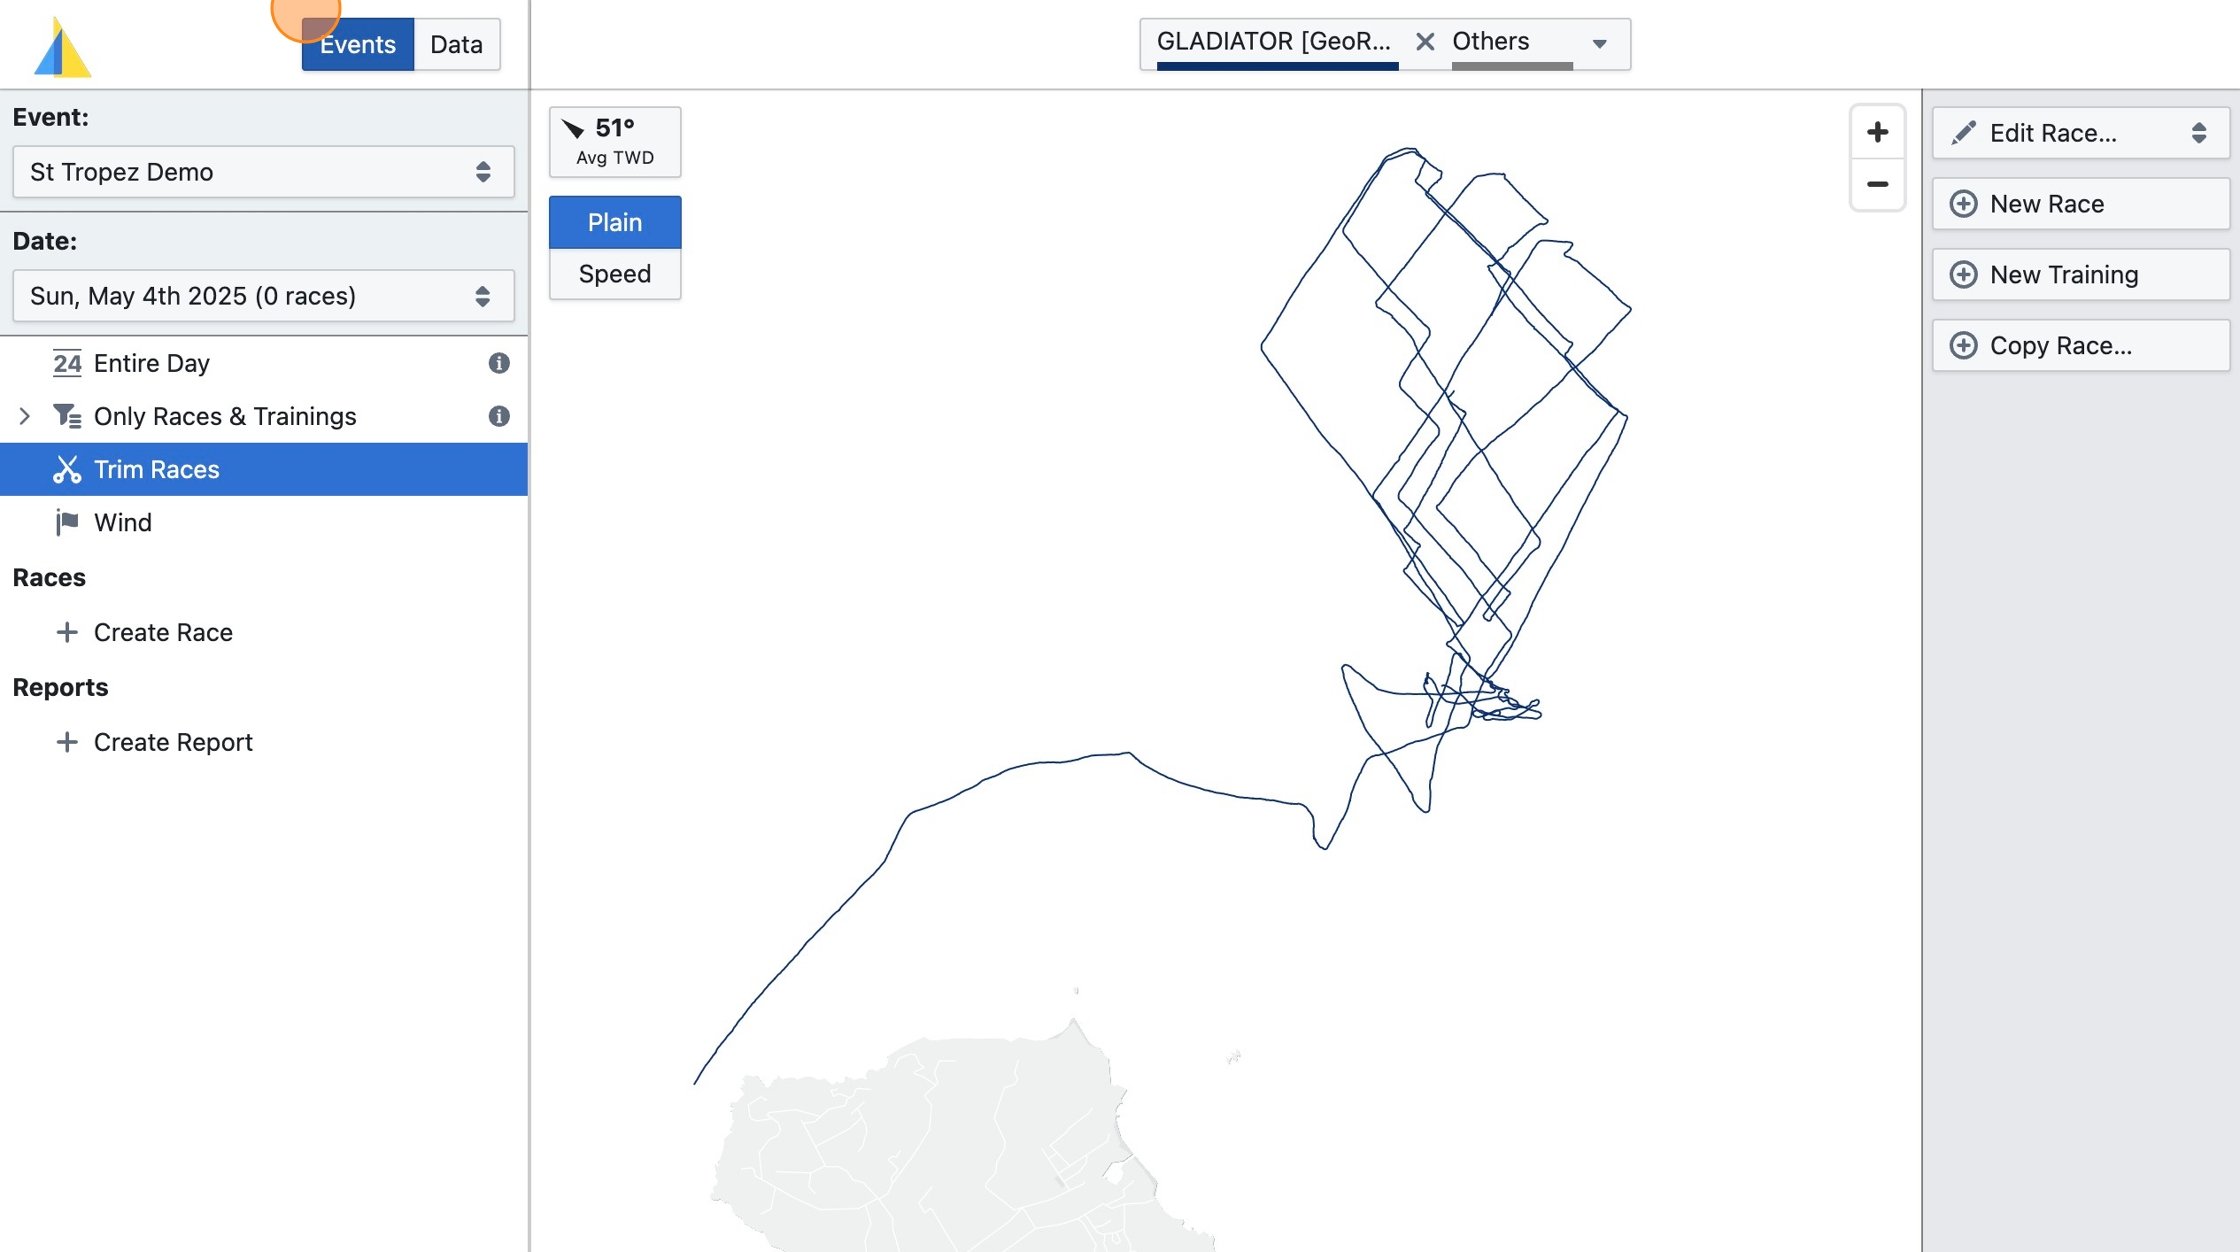
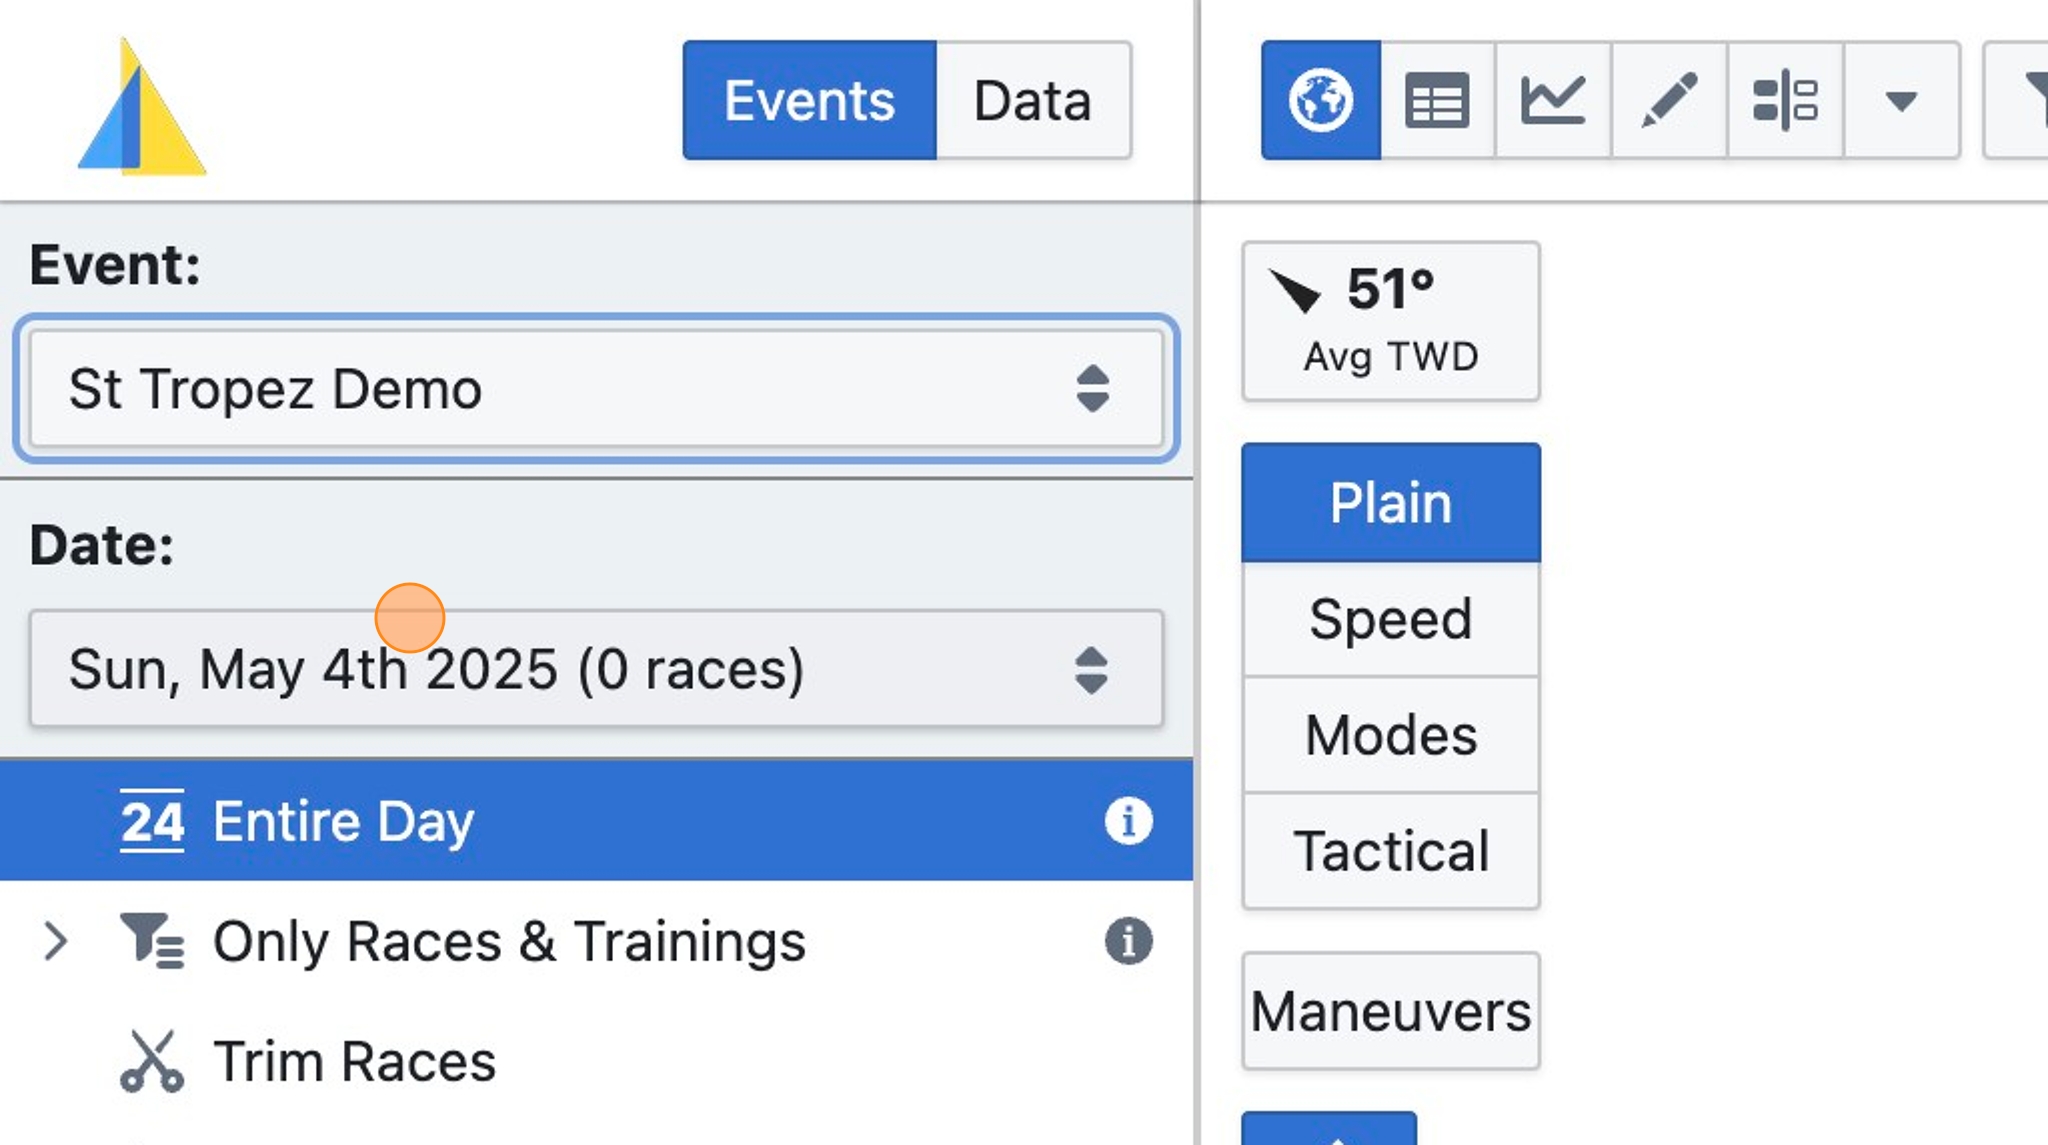
Step 2
Select the Event you would like to add races to
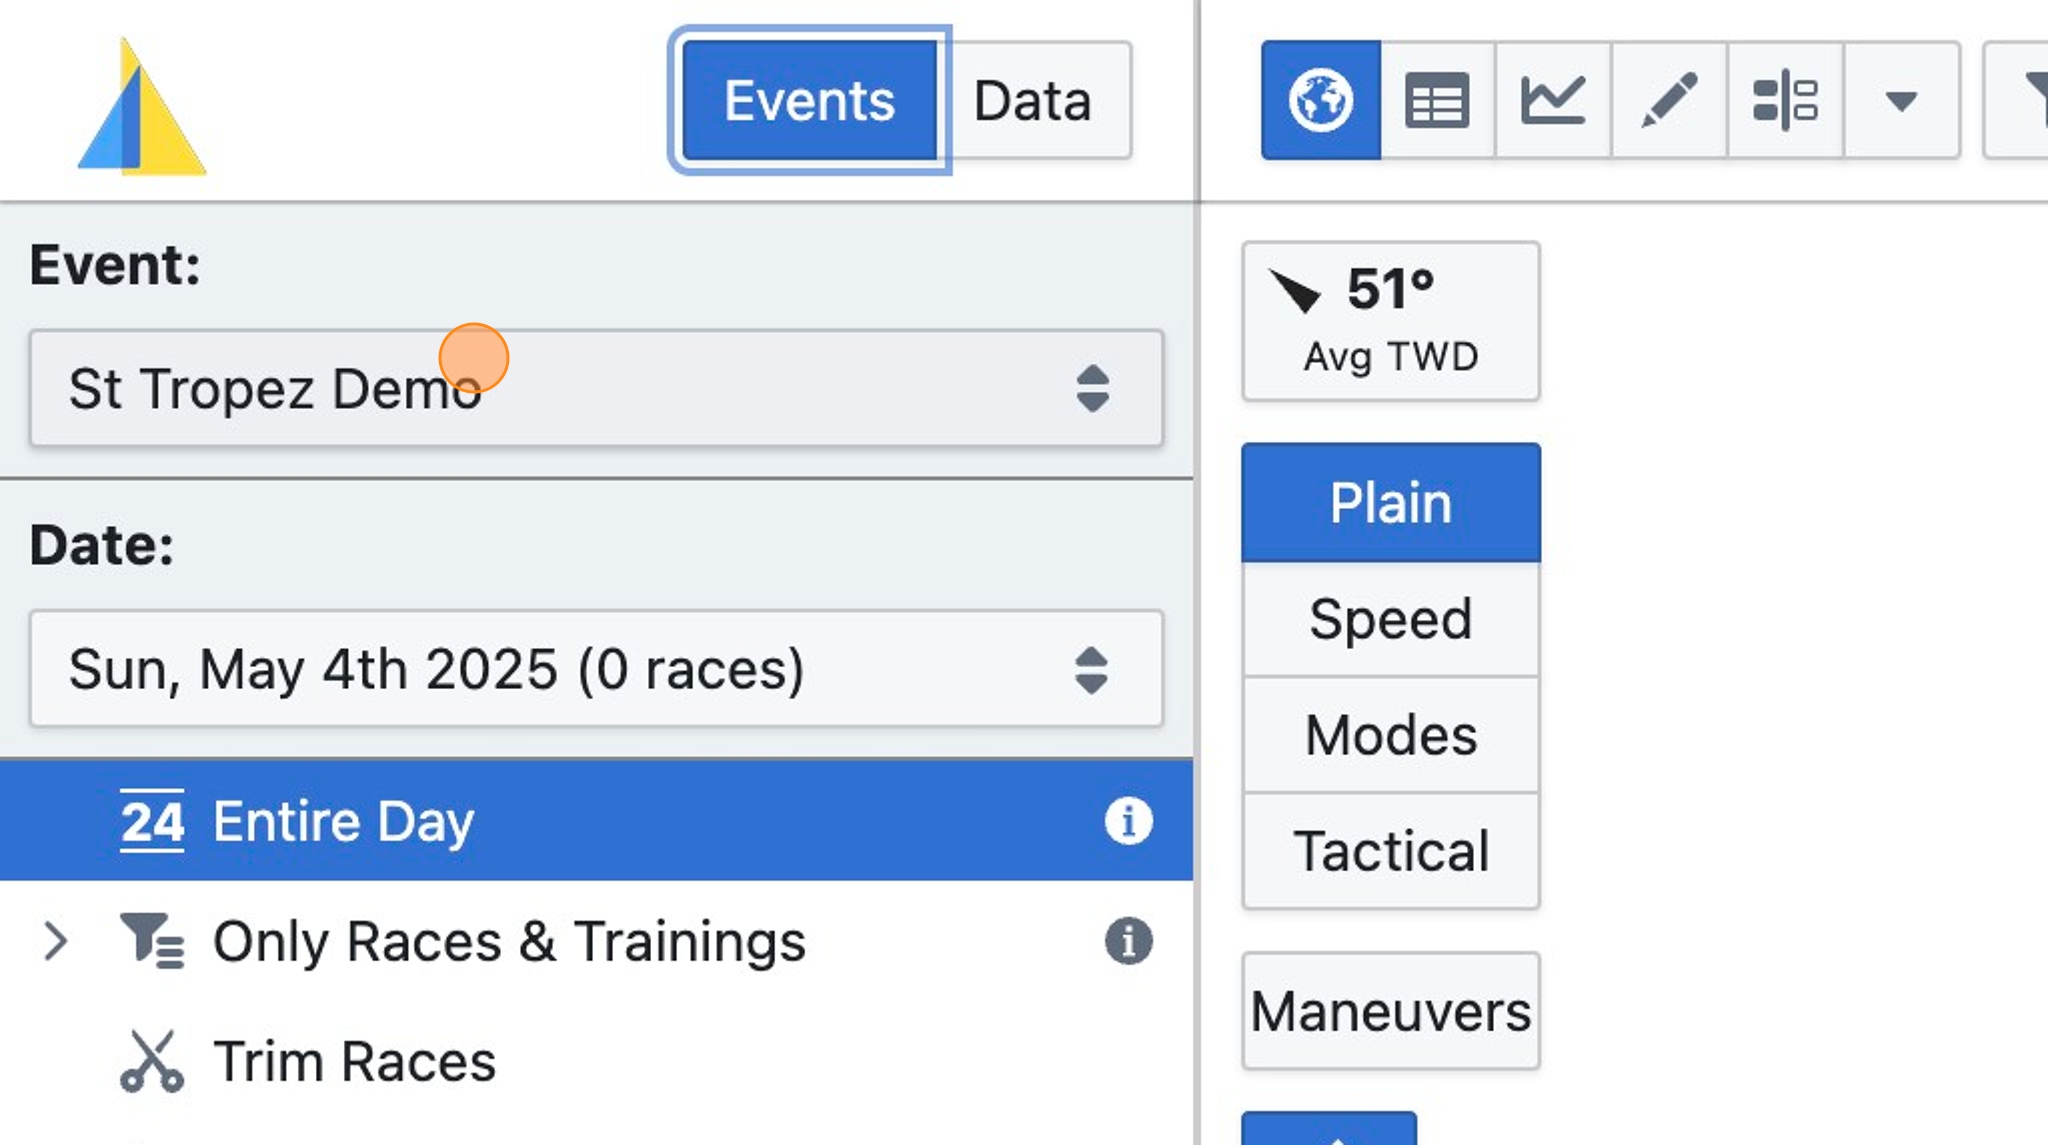
Step 3
Select the relevant date
Step 4
Click "Trim Races"
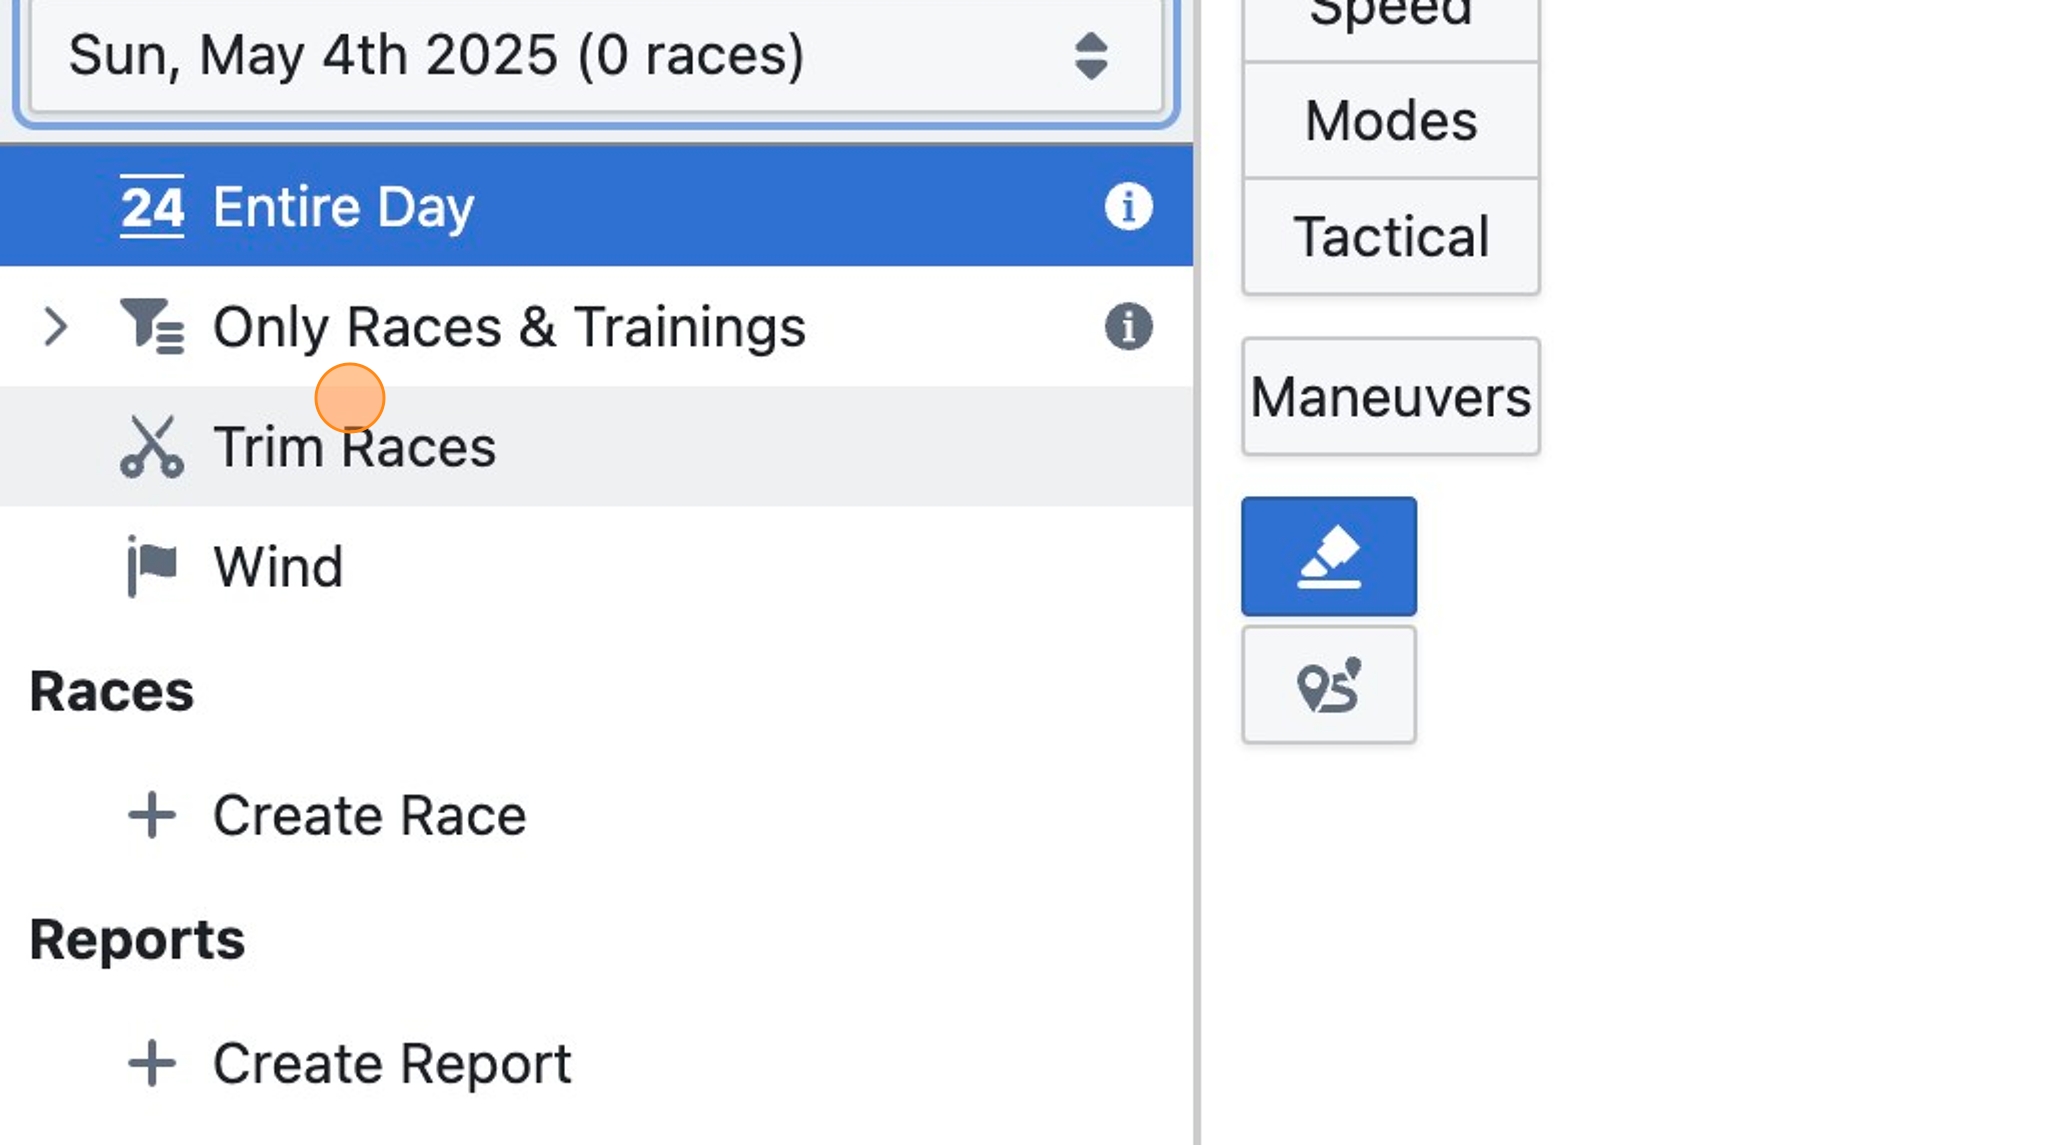
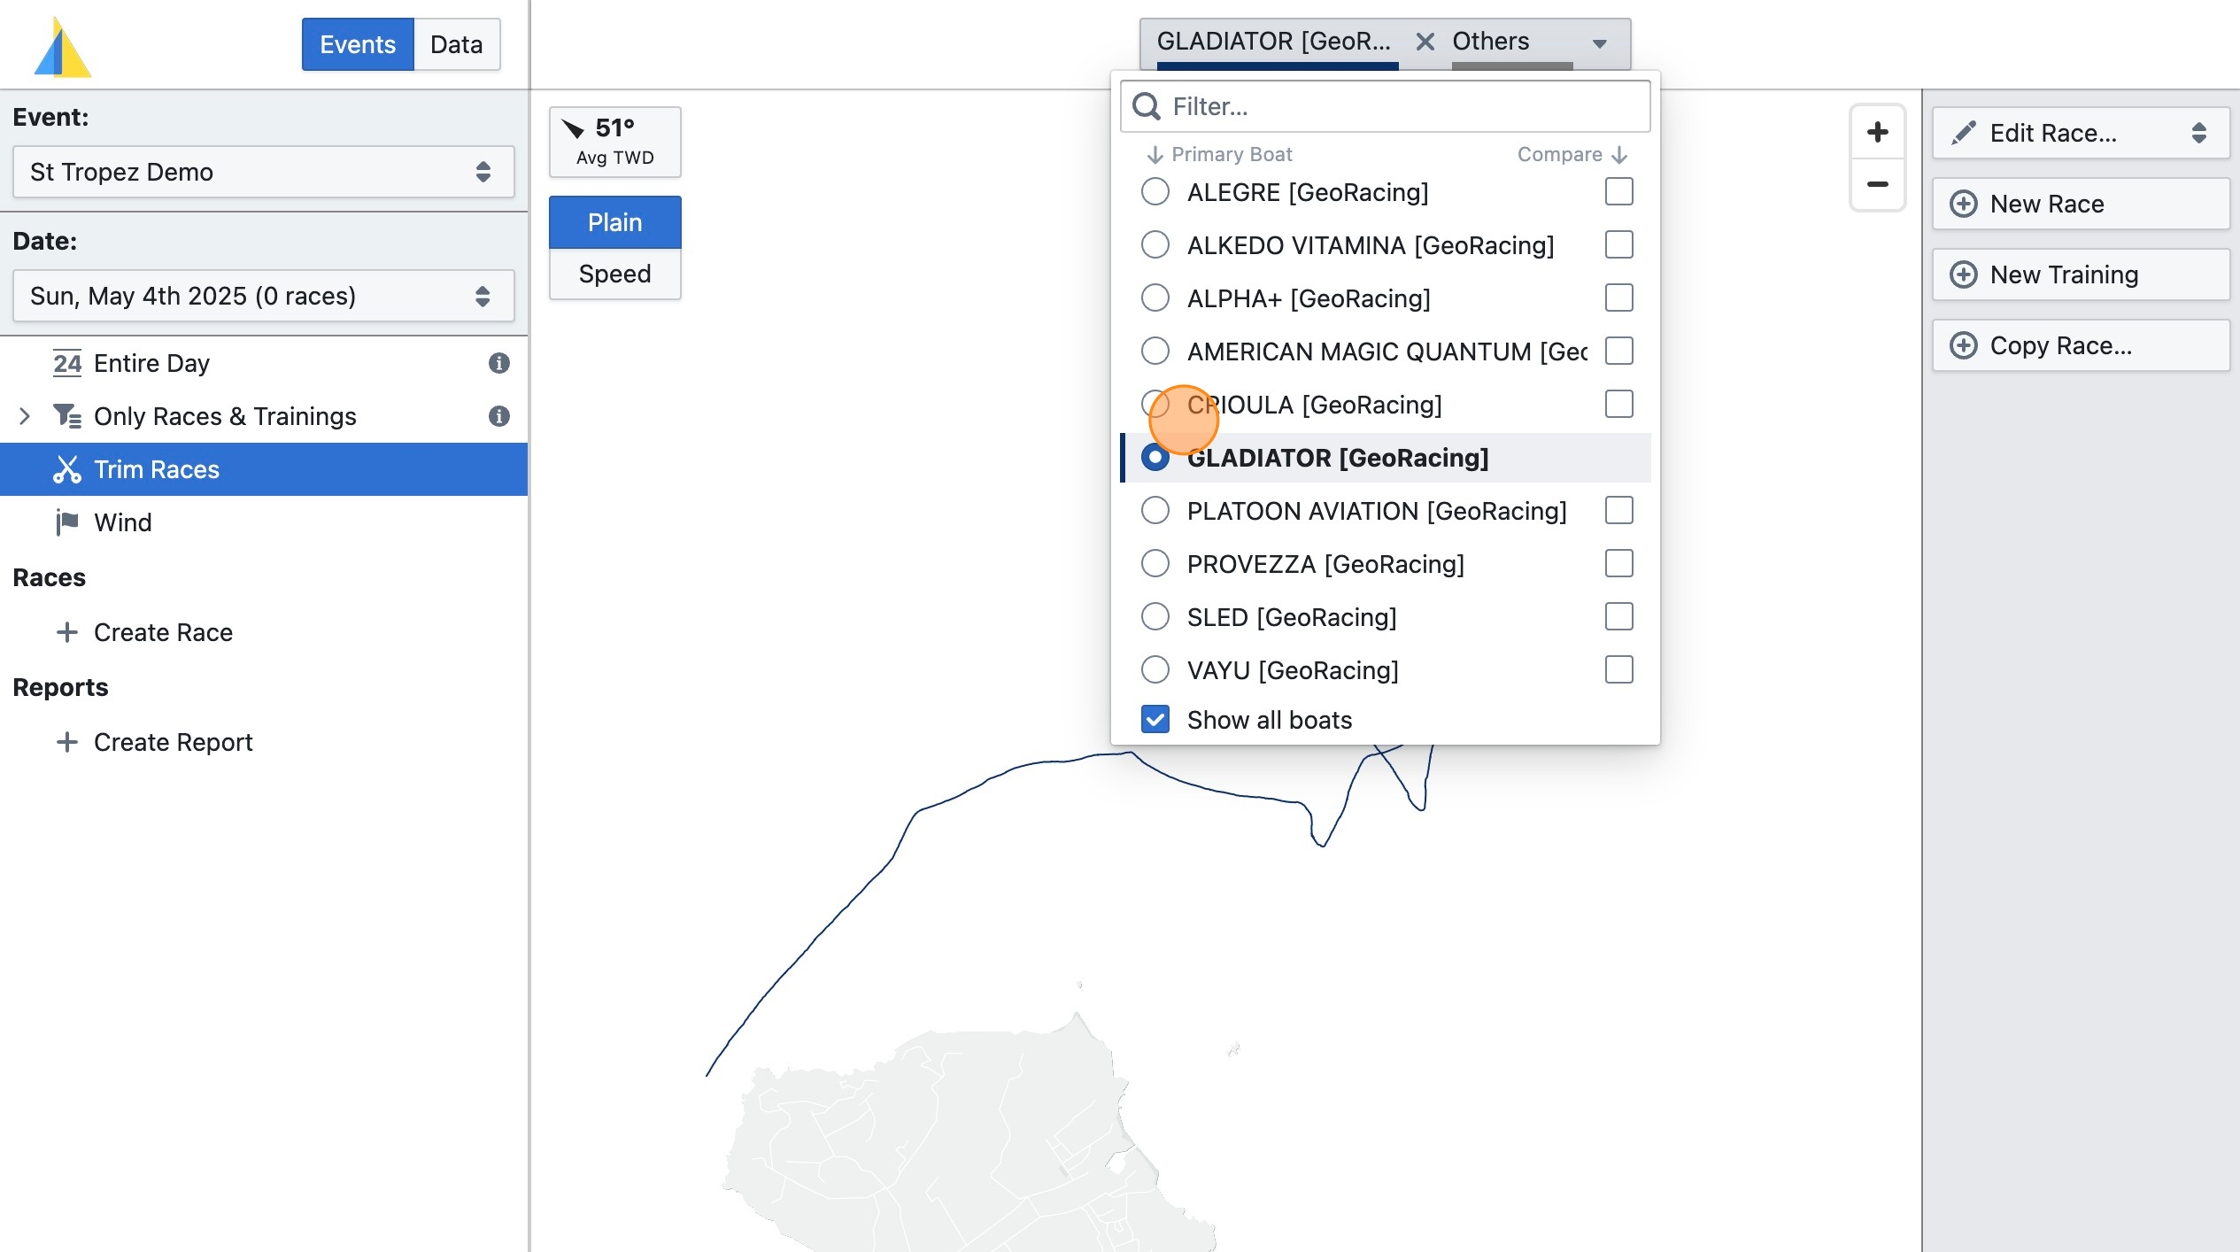
Step 5
Select a representative boat for that date whose track will help you verify that your race covers the correct parts of the track
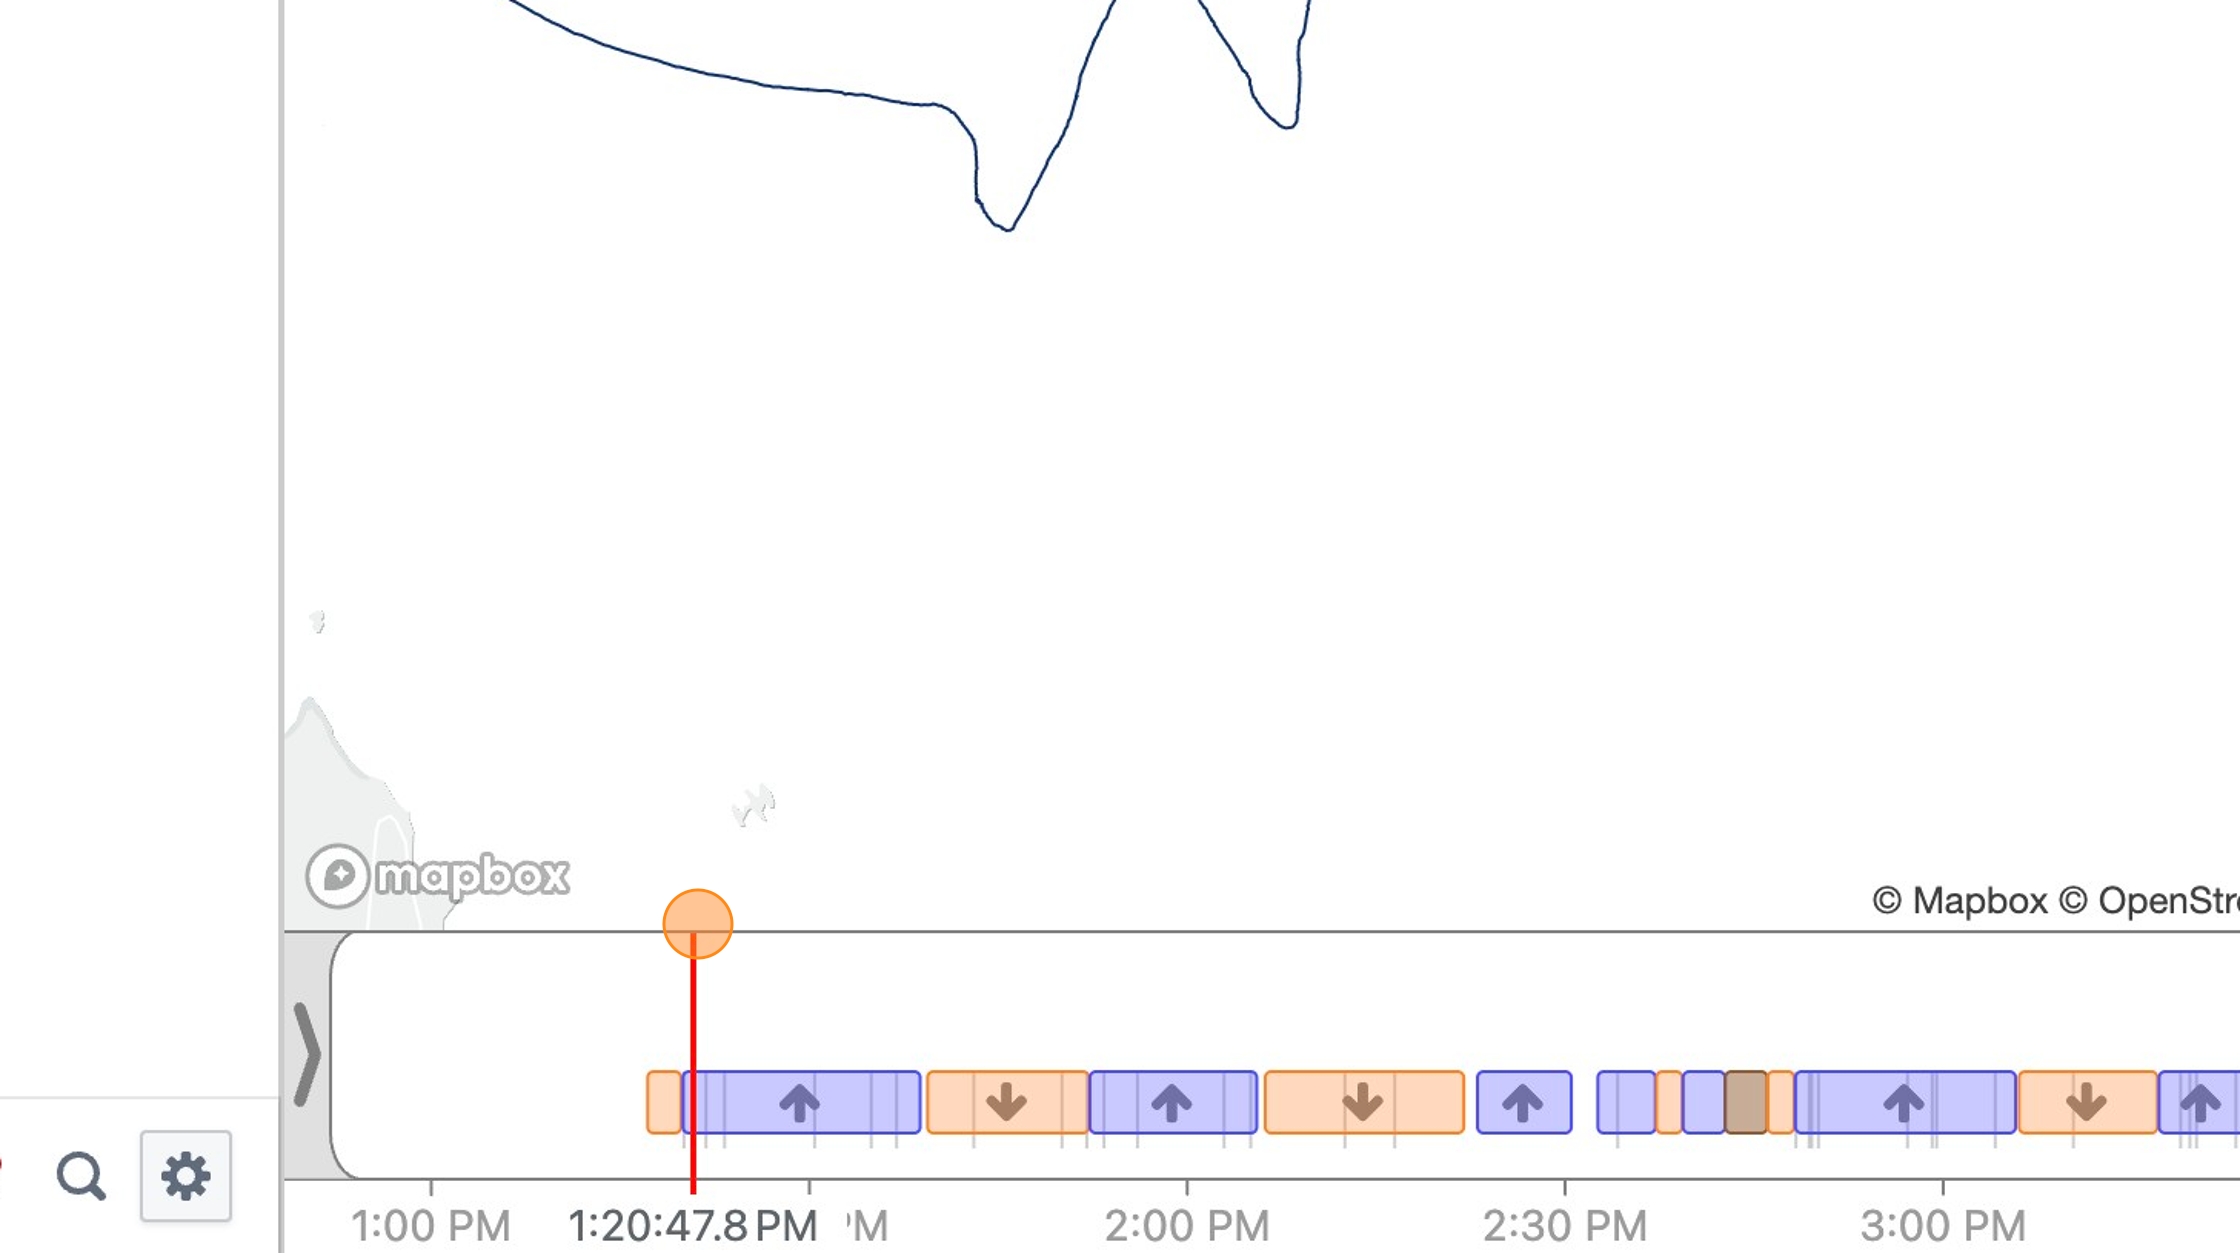
Step 6
One way to create a race is to click and drag on upper portion of the time track to define the start and end time (you can fine tune later)
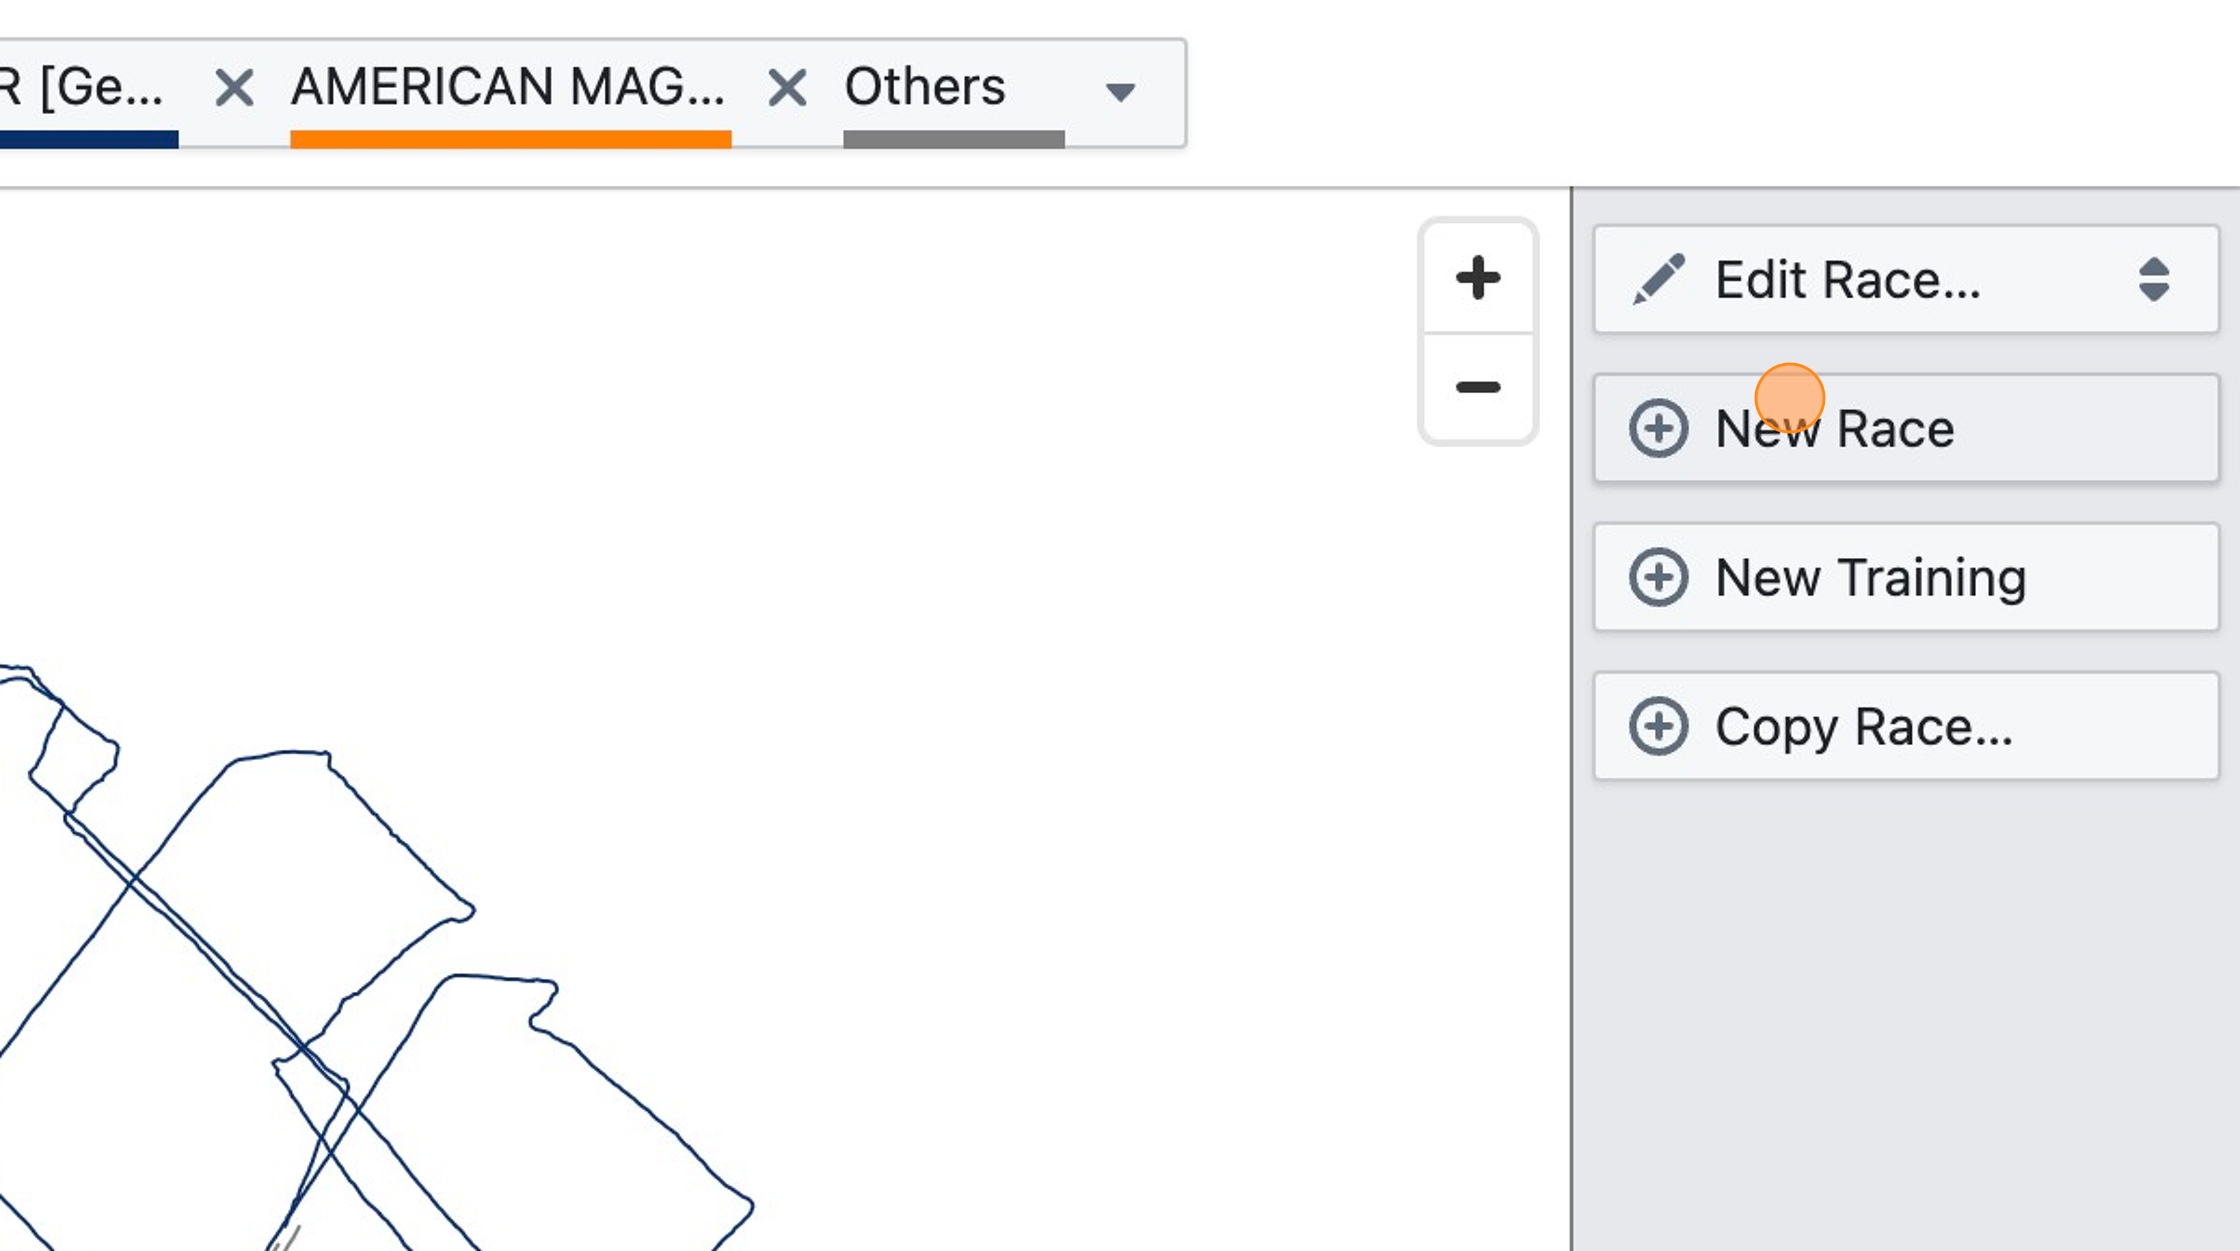
Step 7
Another option is to click "New Race" for a race (or "New Training" for a training segment)
Step 8
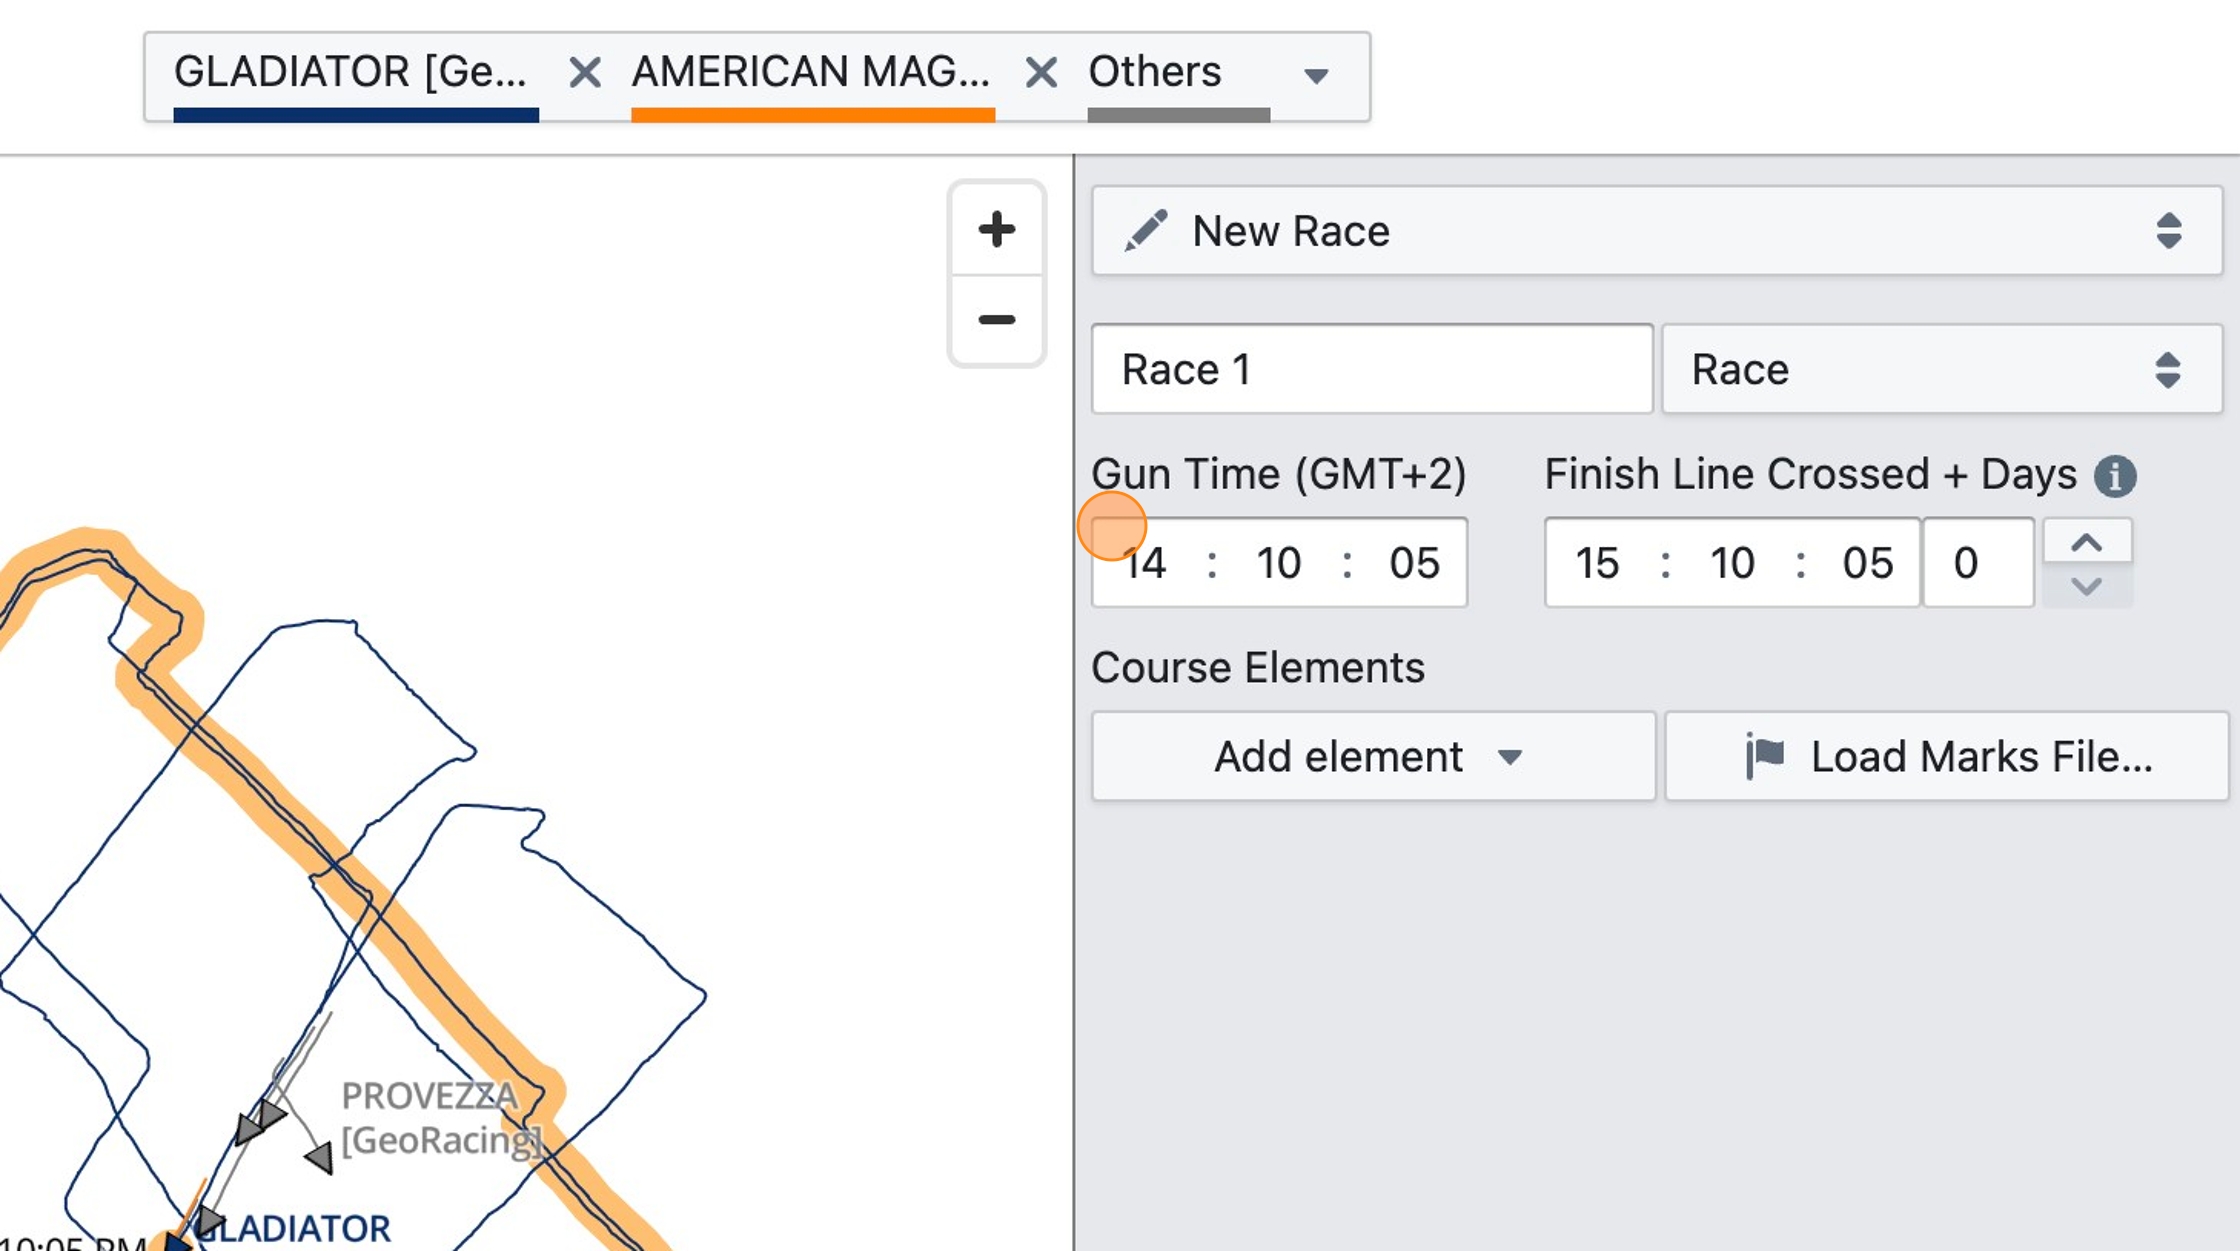
Click the name field and enter a name for your race (optional)
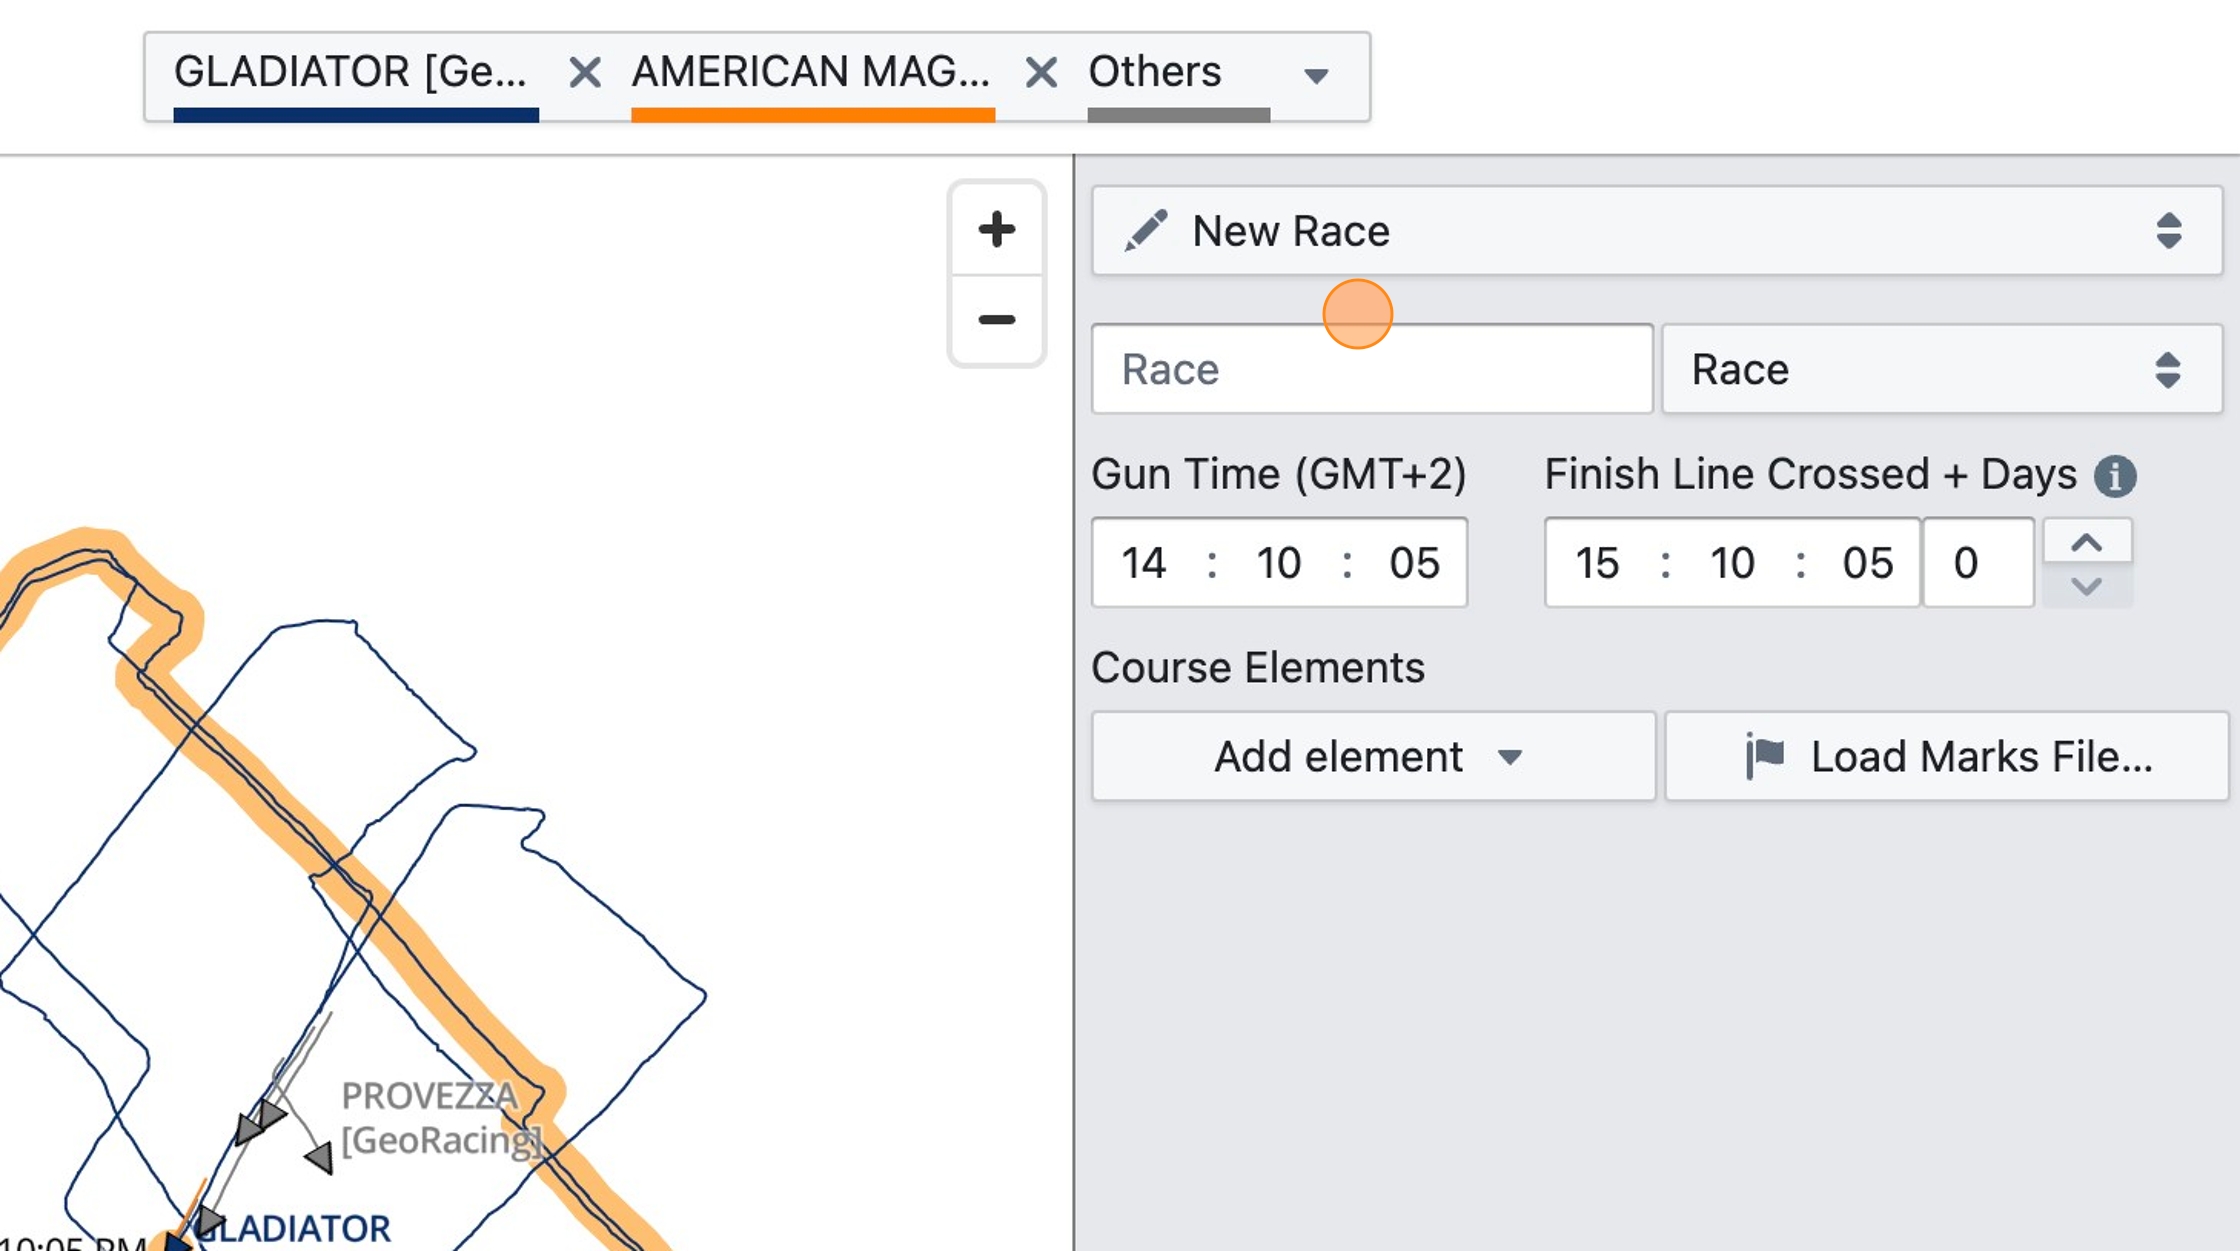
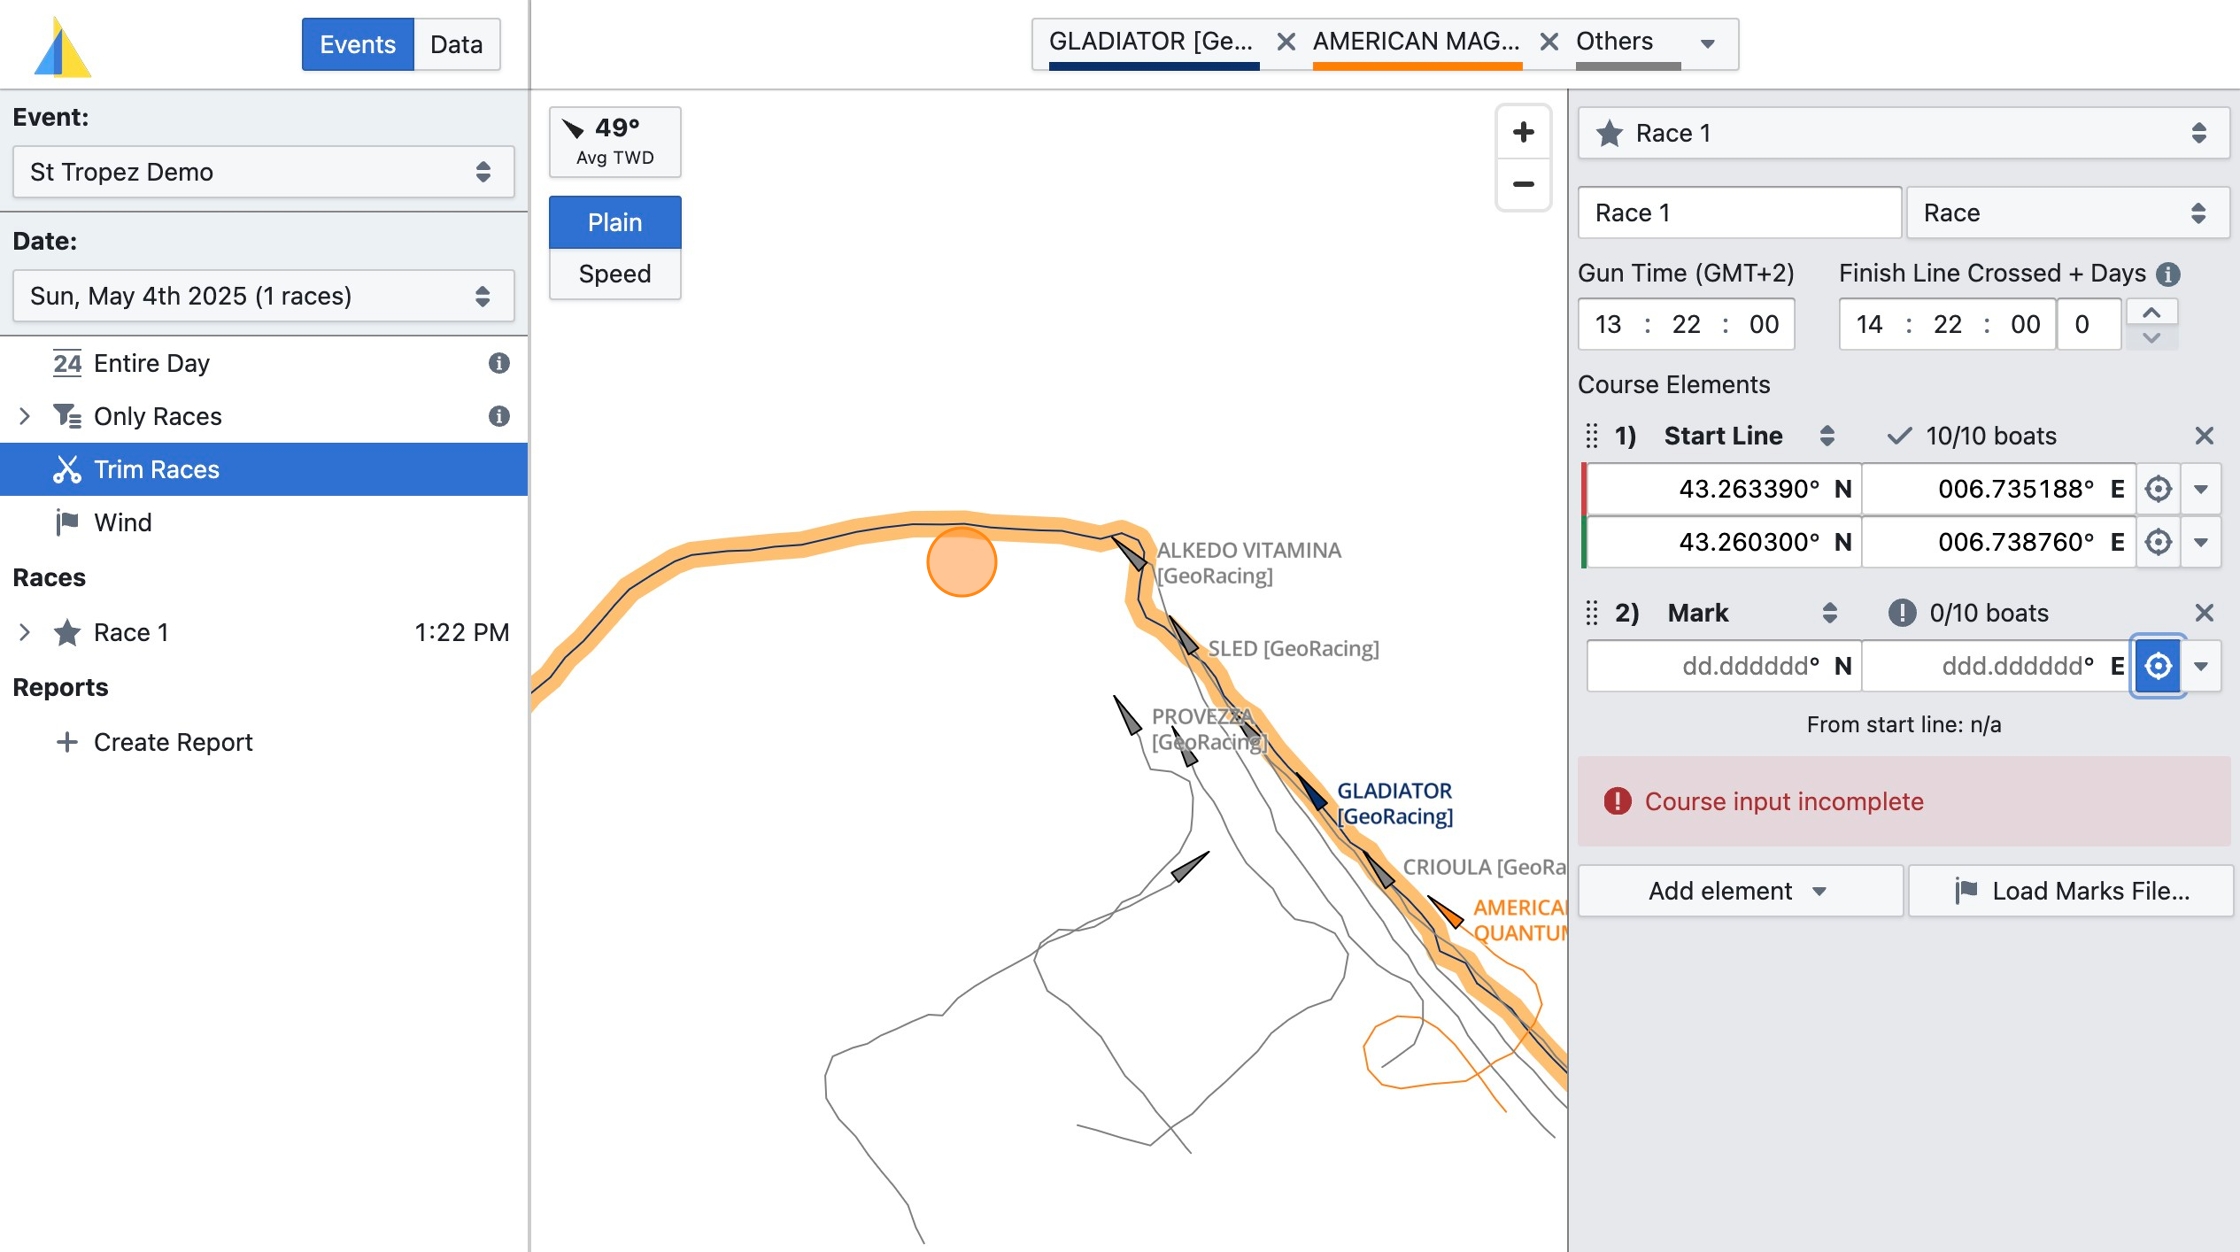
Step 9
Click the "Gun Time" field and enter the start (gun) time of the race. Also enter the finish time. The finish time should after all boats have crossed the finish line to ensure the last leg can be completely analyzed for all boats.
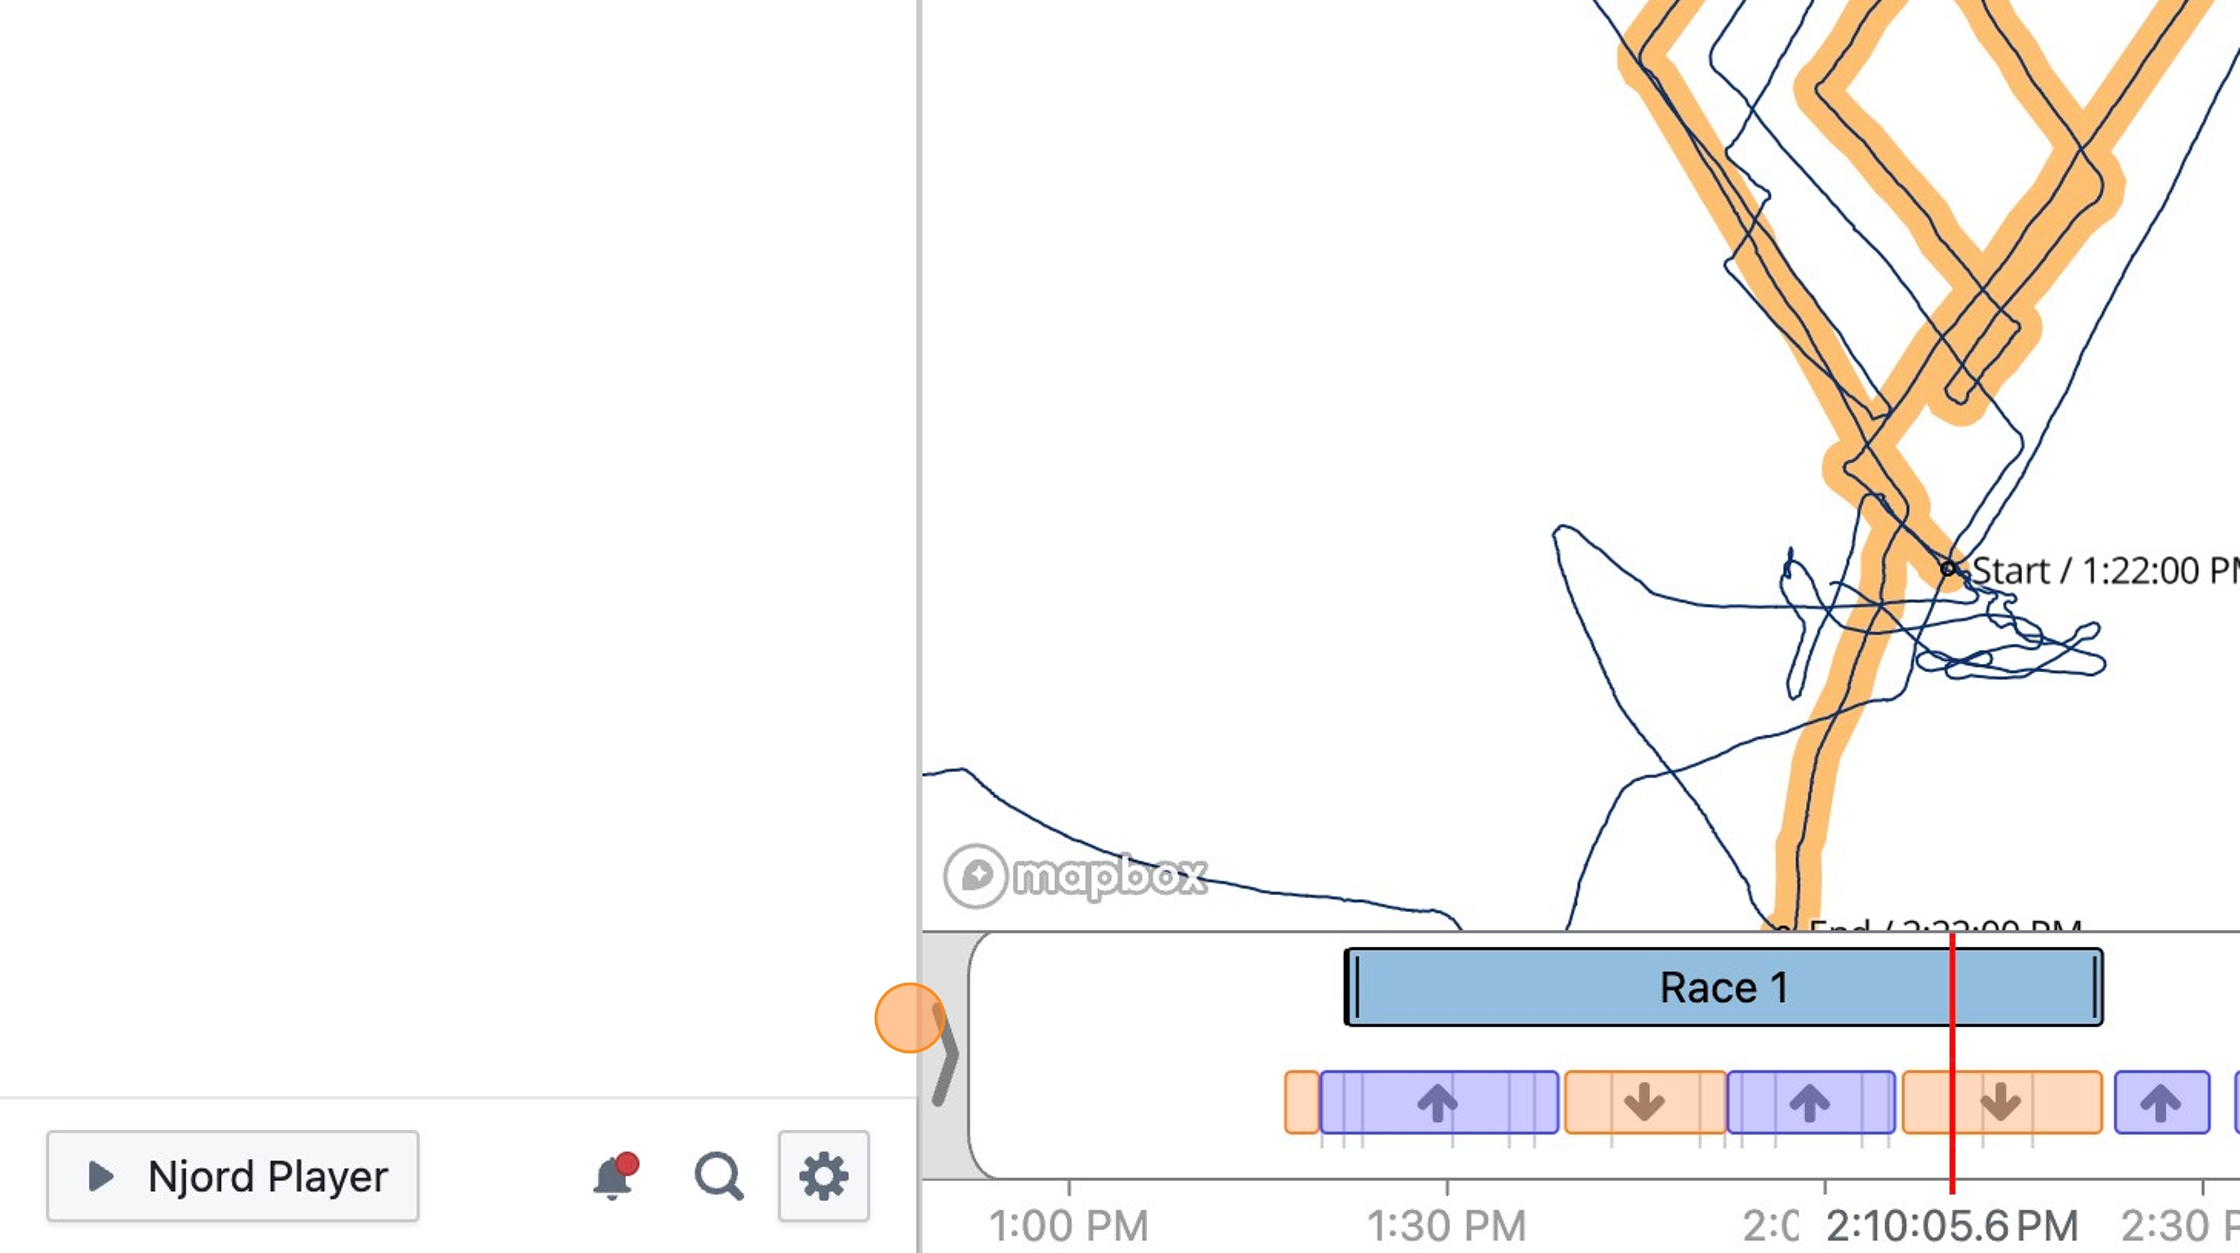
Step 10
To help you visualize the boat's tracks during a specific race only and to remove clutter, you can use the narrow focus tool to restrict the portion of the day's tracks that is visible on the map. Use the left and right side tool to define your focus area.
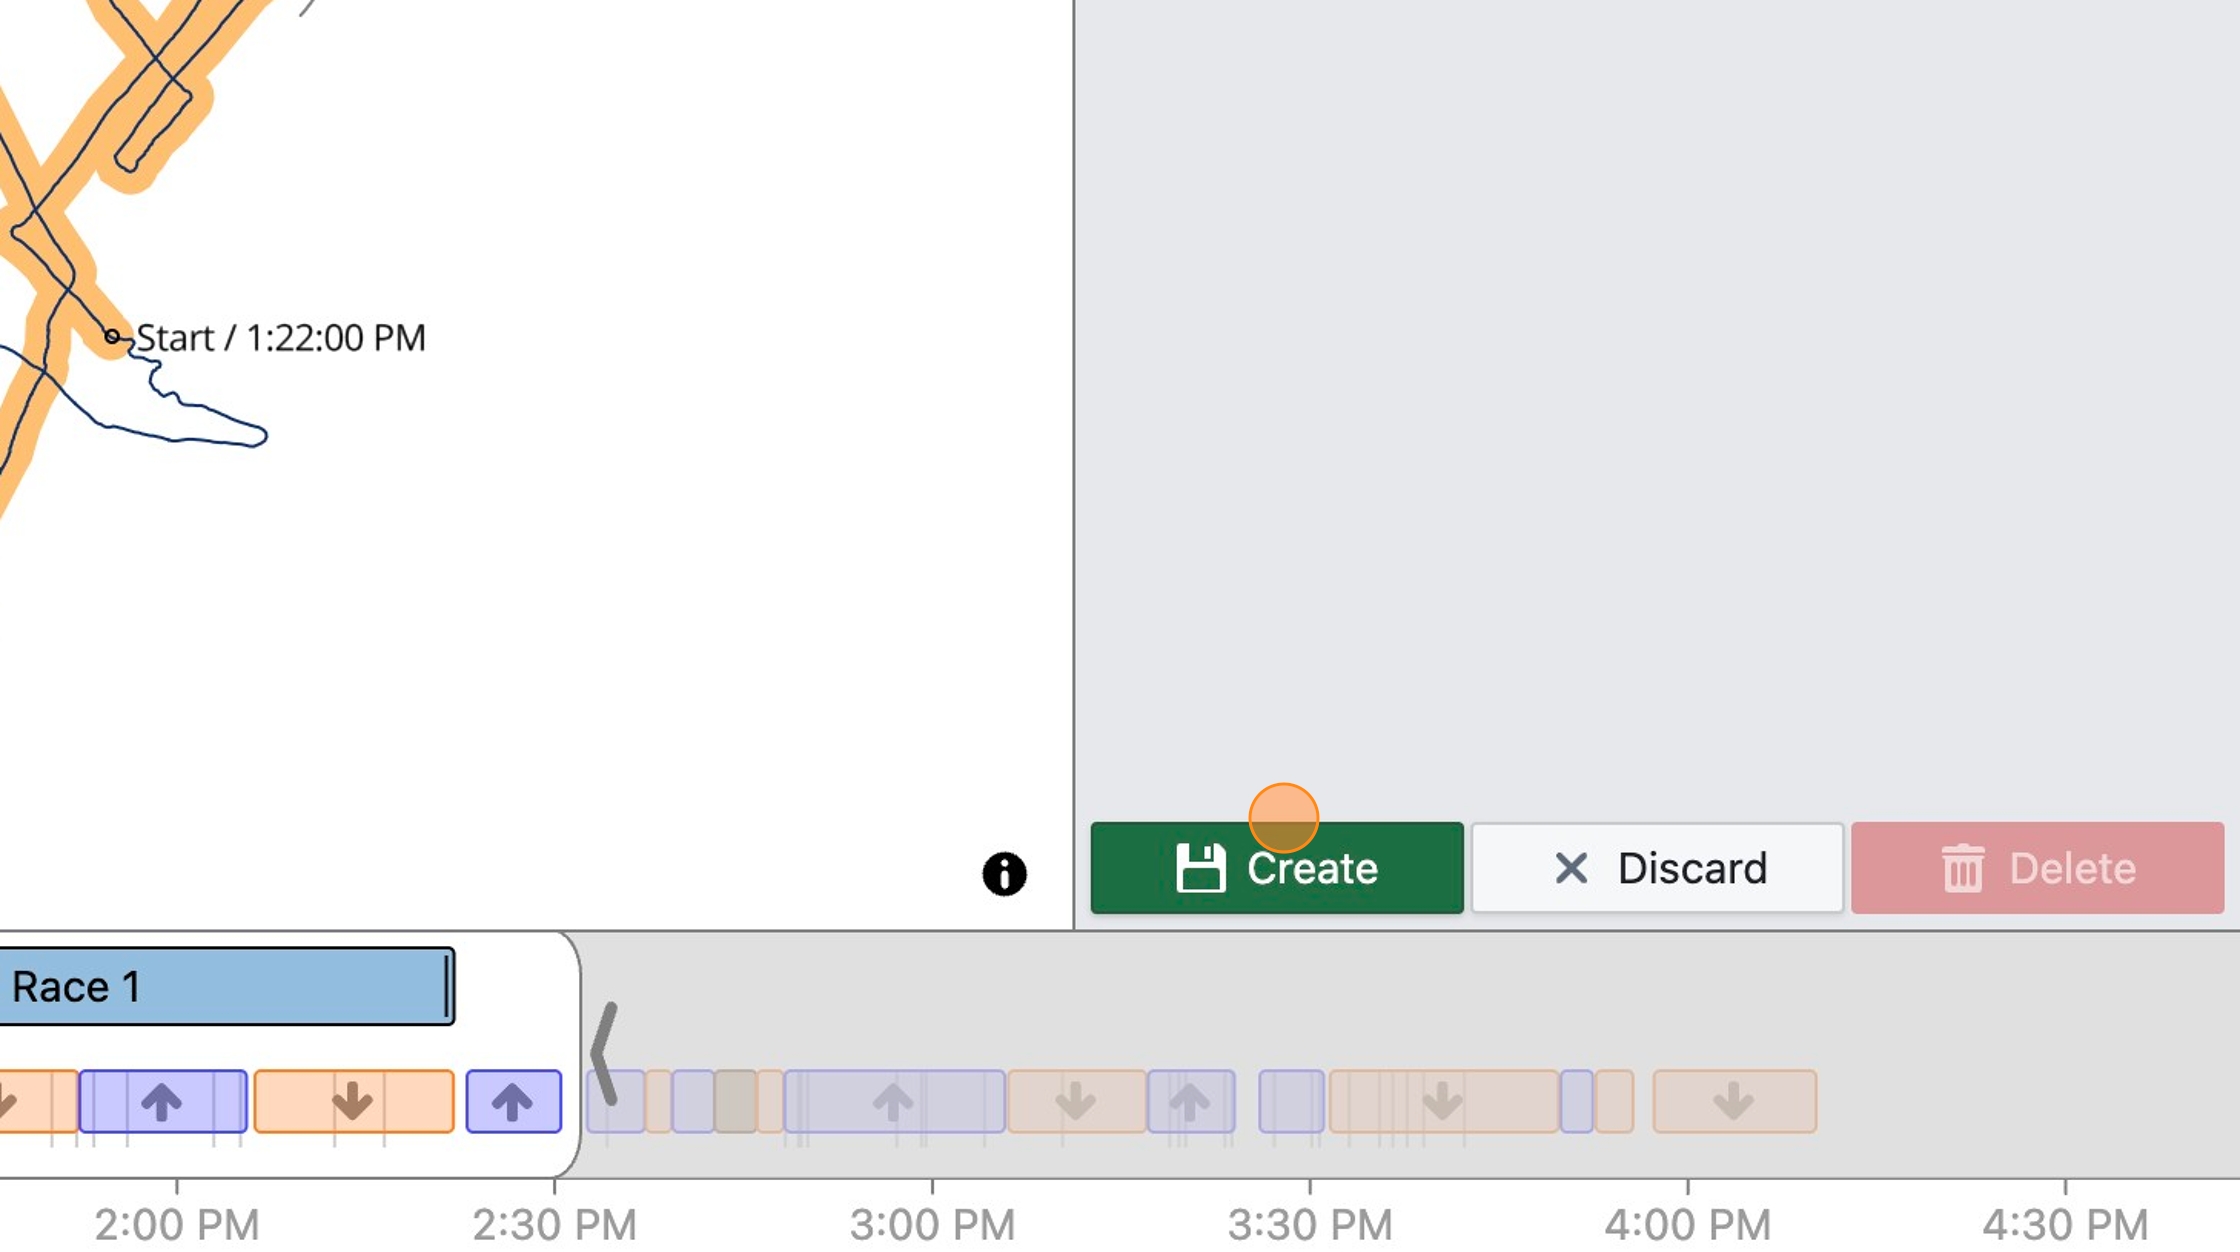
Step 11
To finalize and save the race you entered, click "Create"
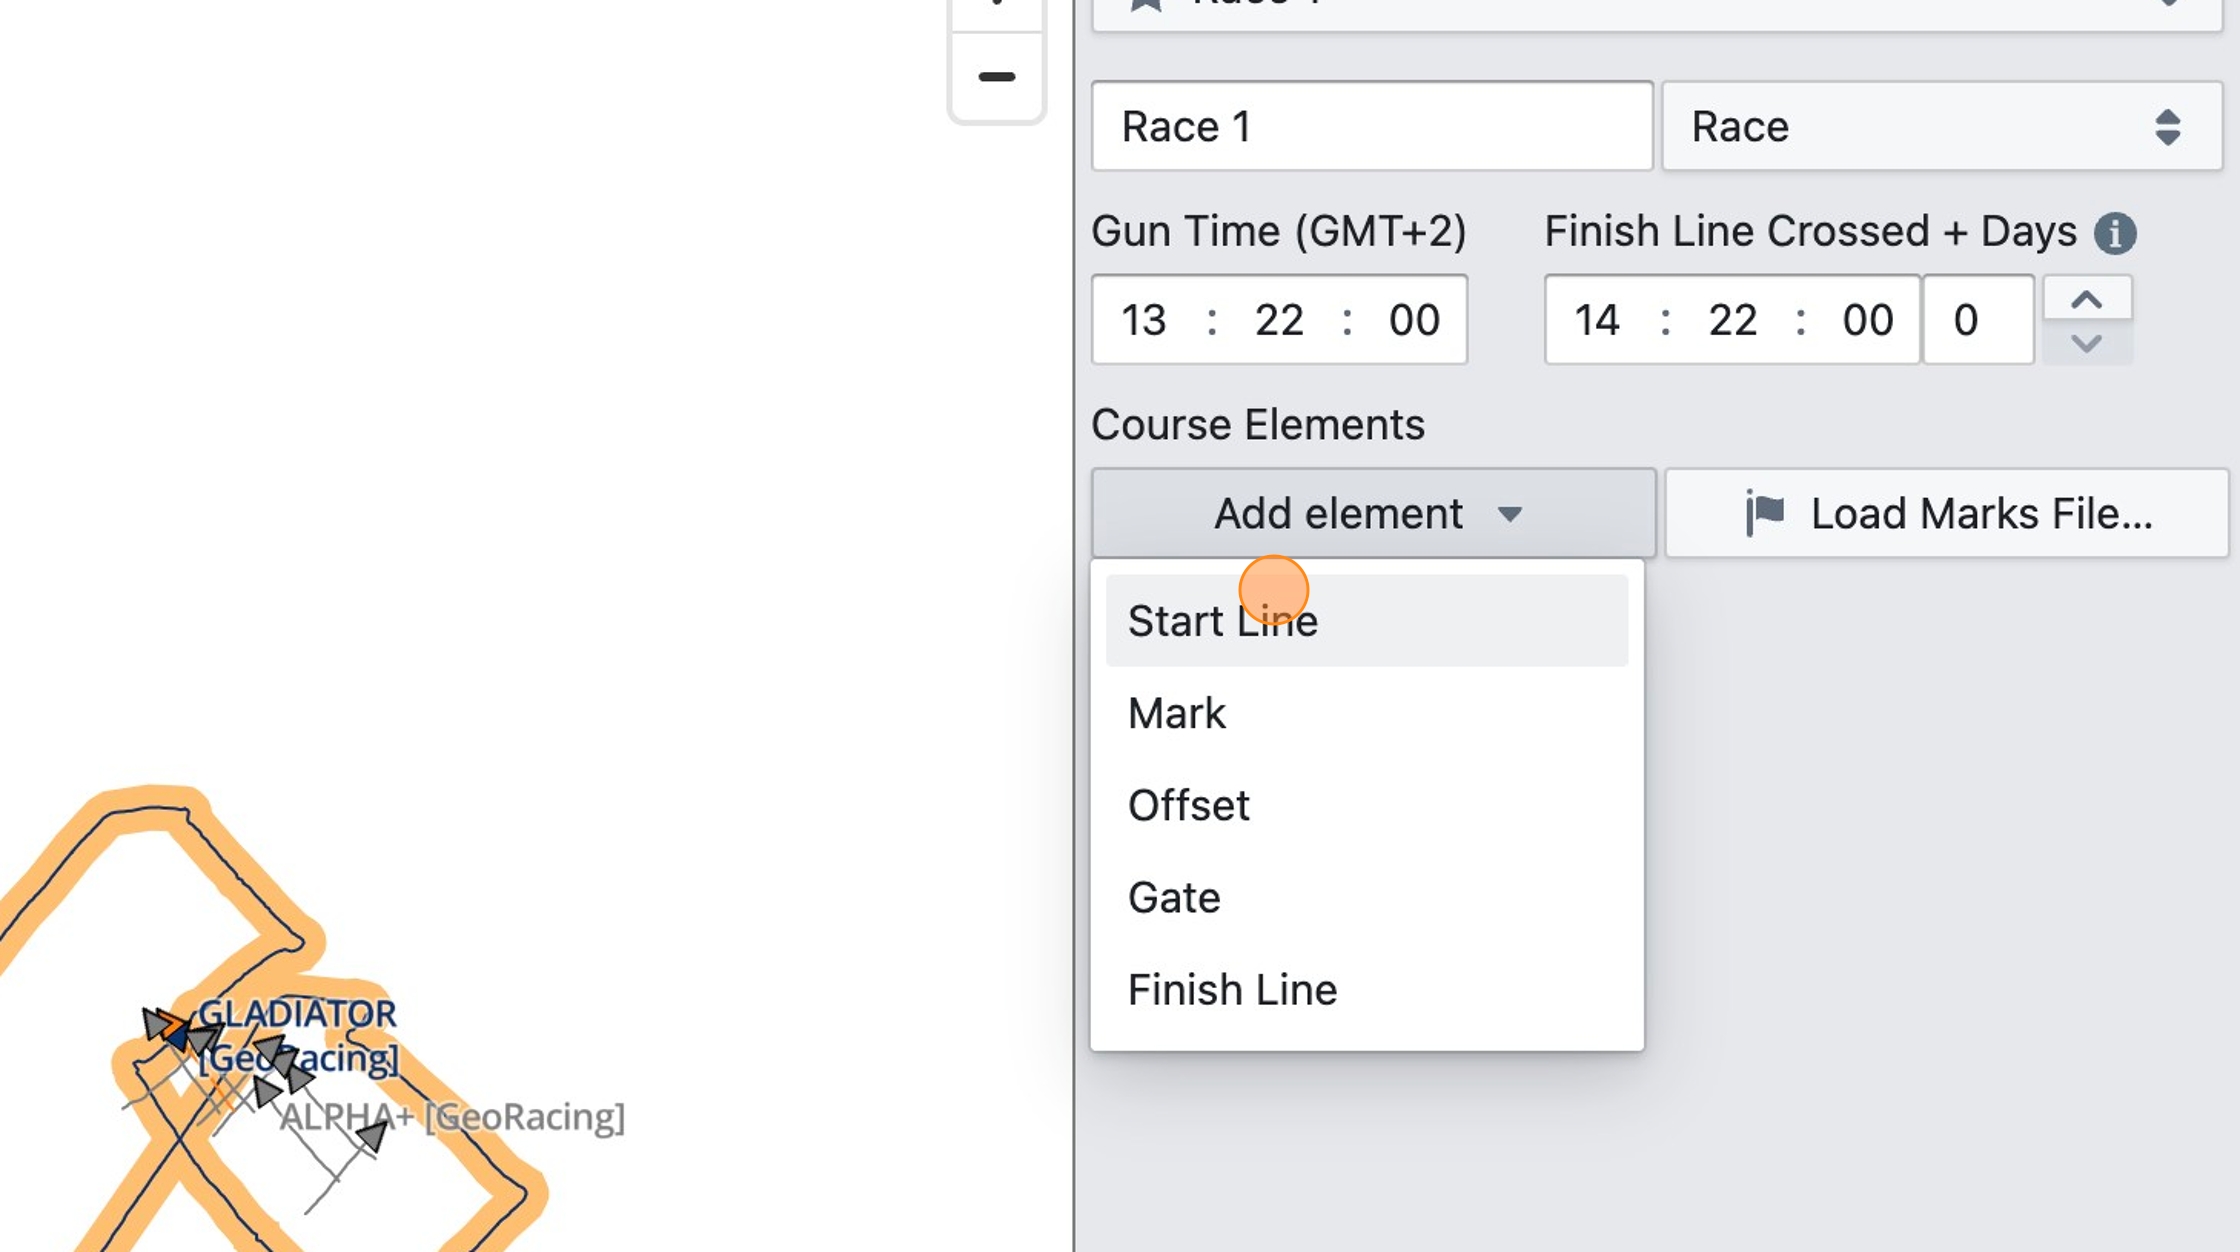
Step 12
To define a course for your race, click "Add element" under "Course Elements" and select an element to add (start with a start line, end with a finish line).
Adding a course to the race will help you analyze the race, in particular the start, and it will break down the race into legs based on when the boats round the marks.
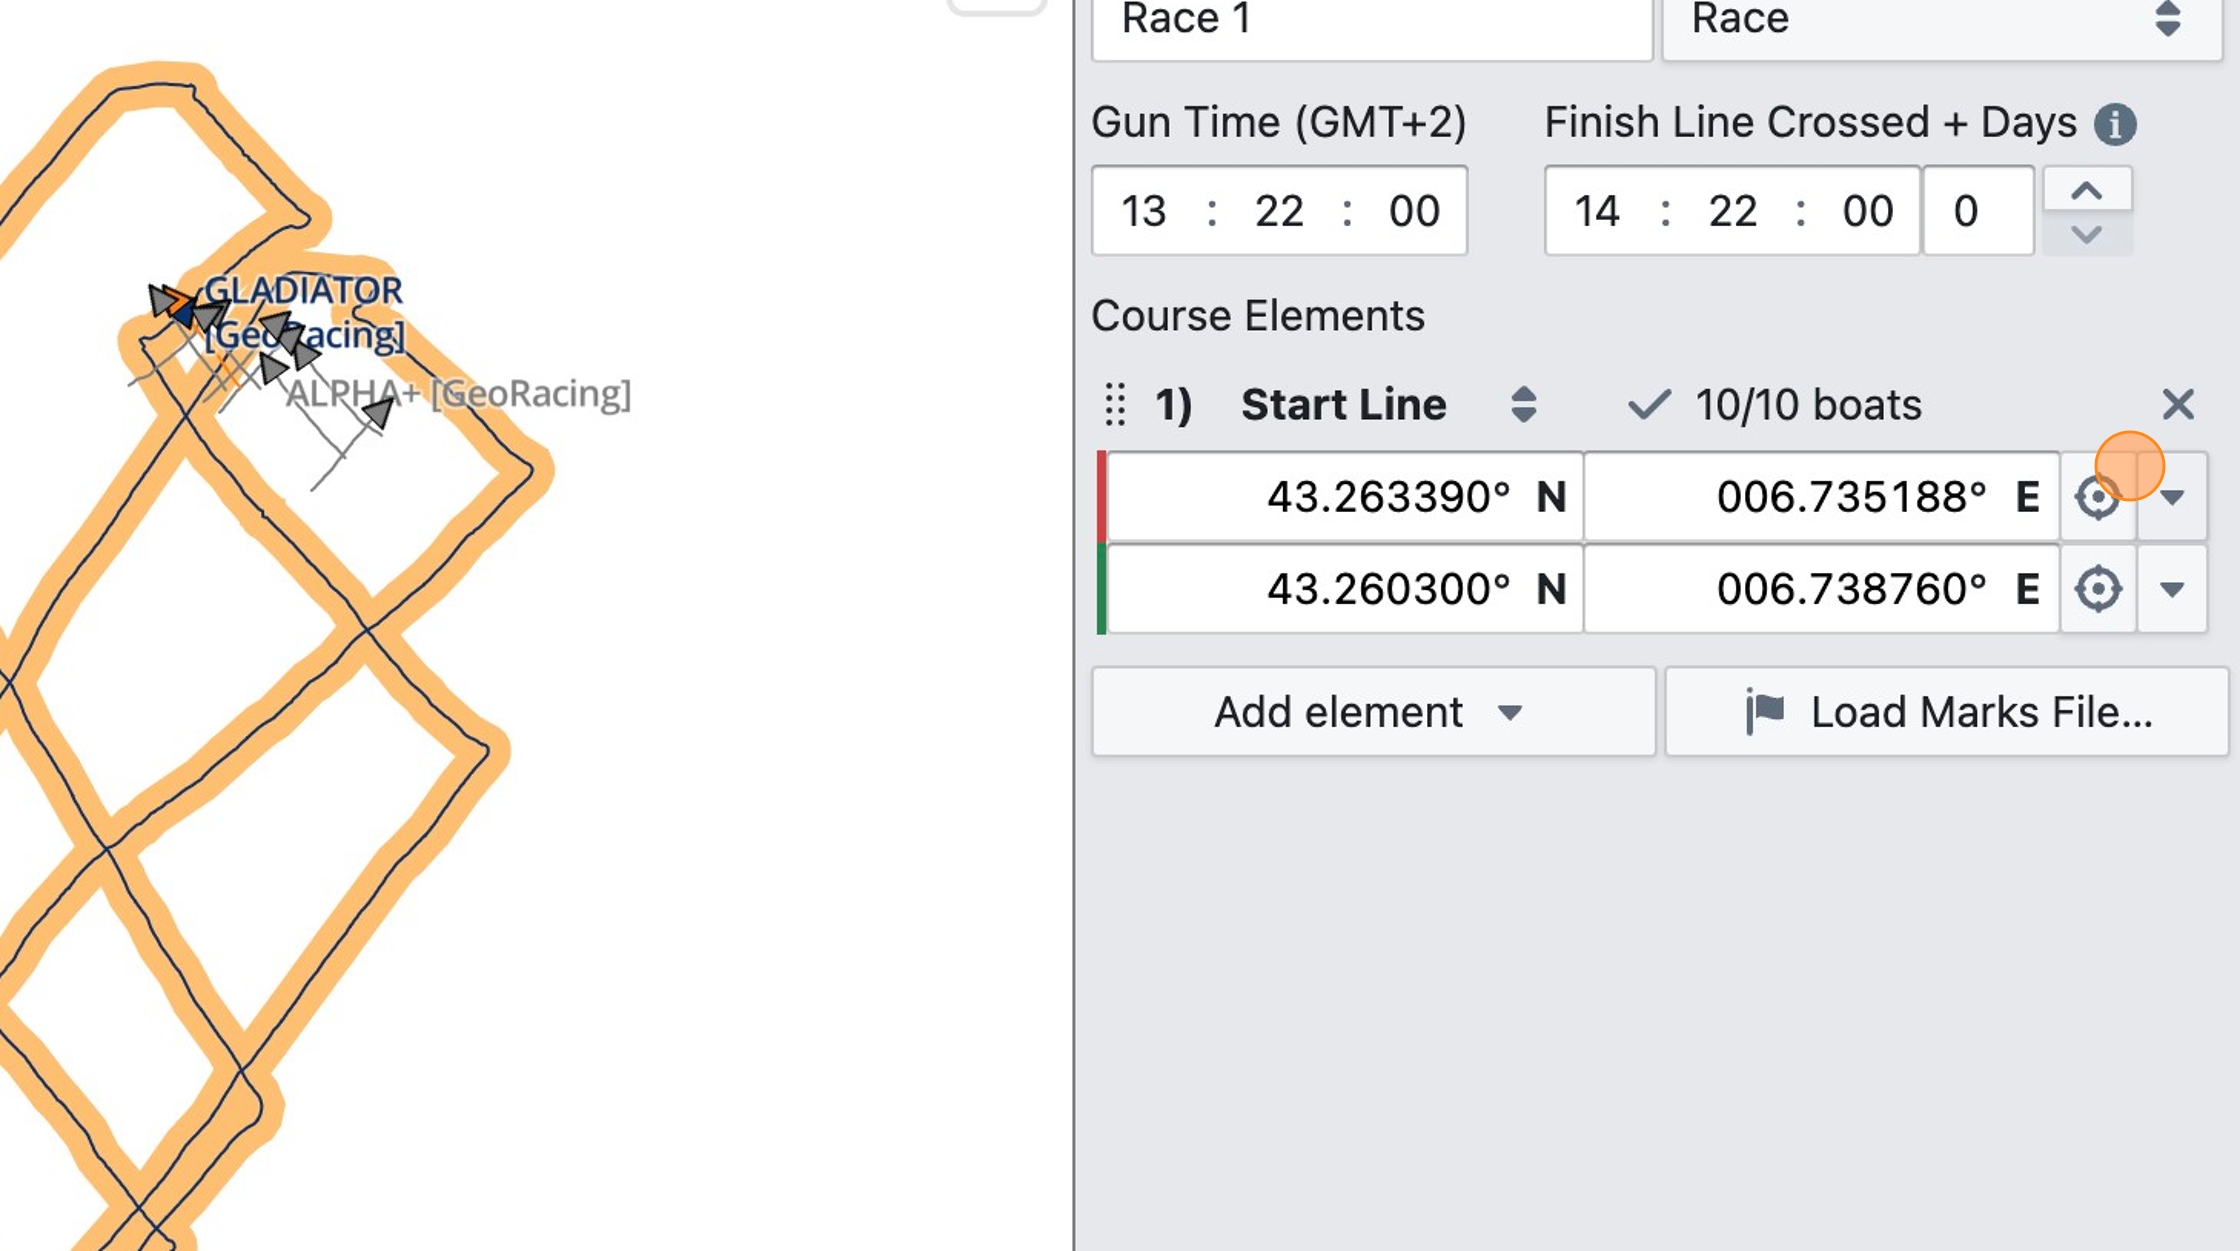
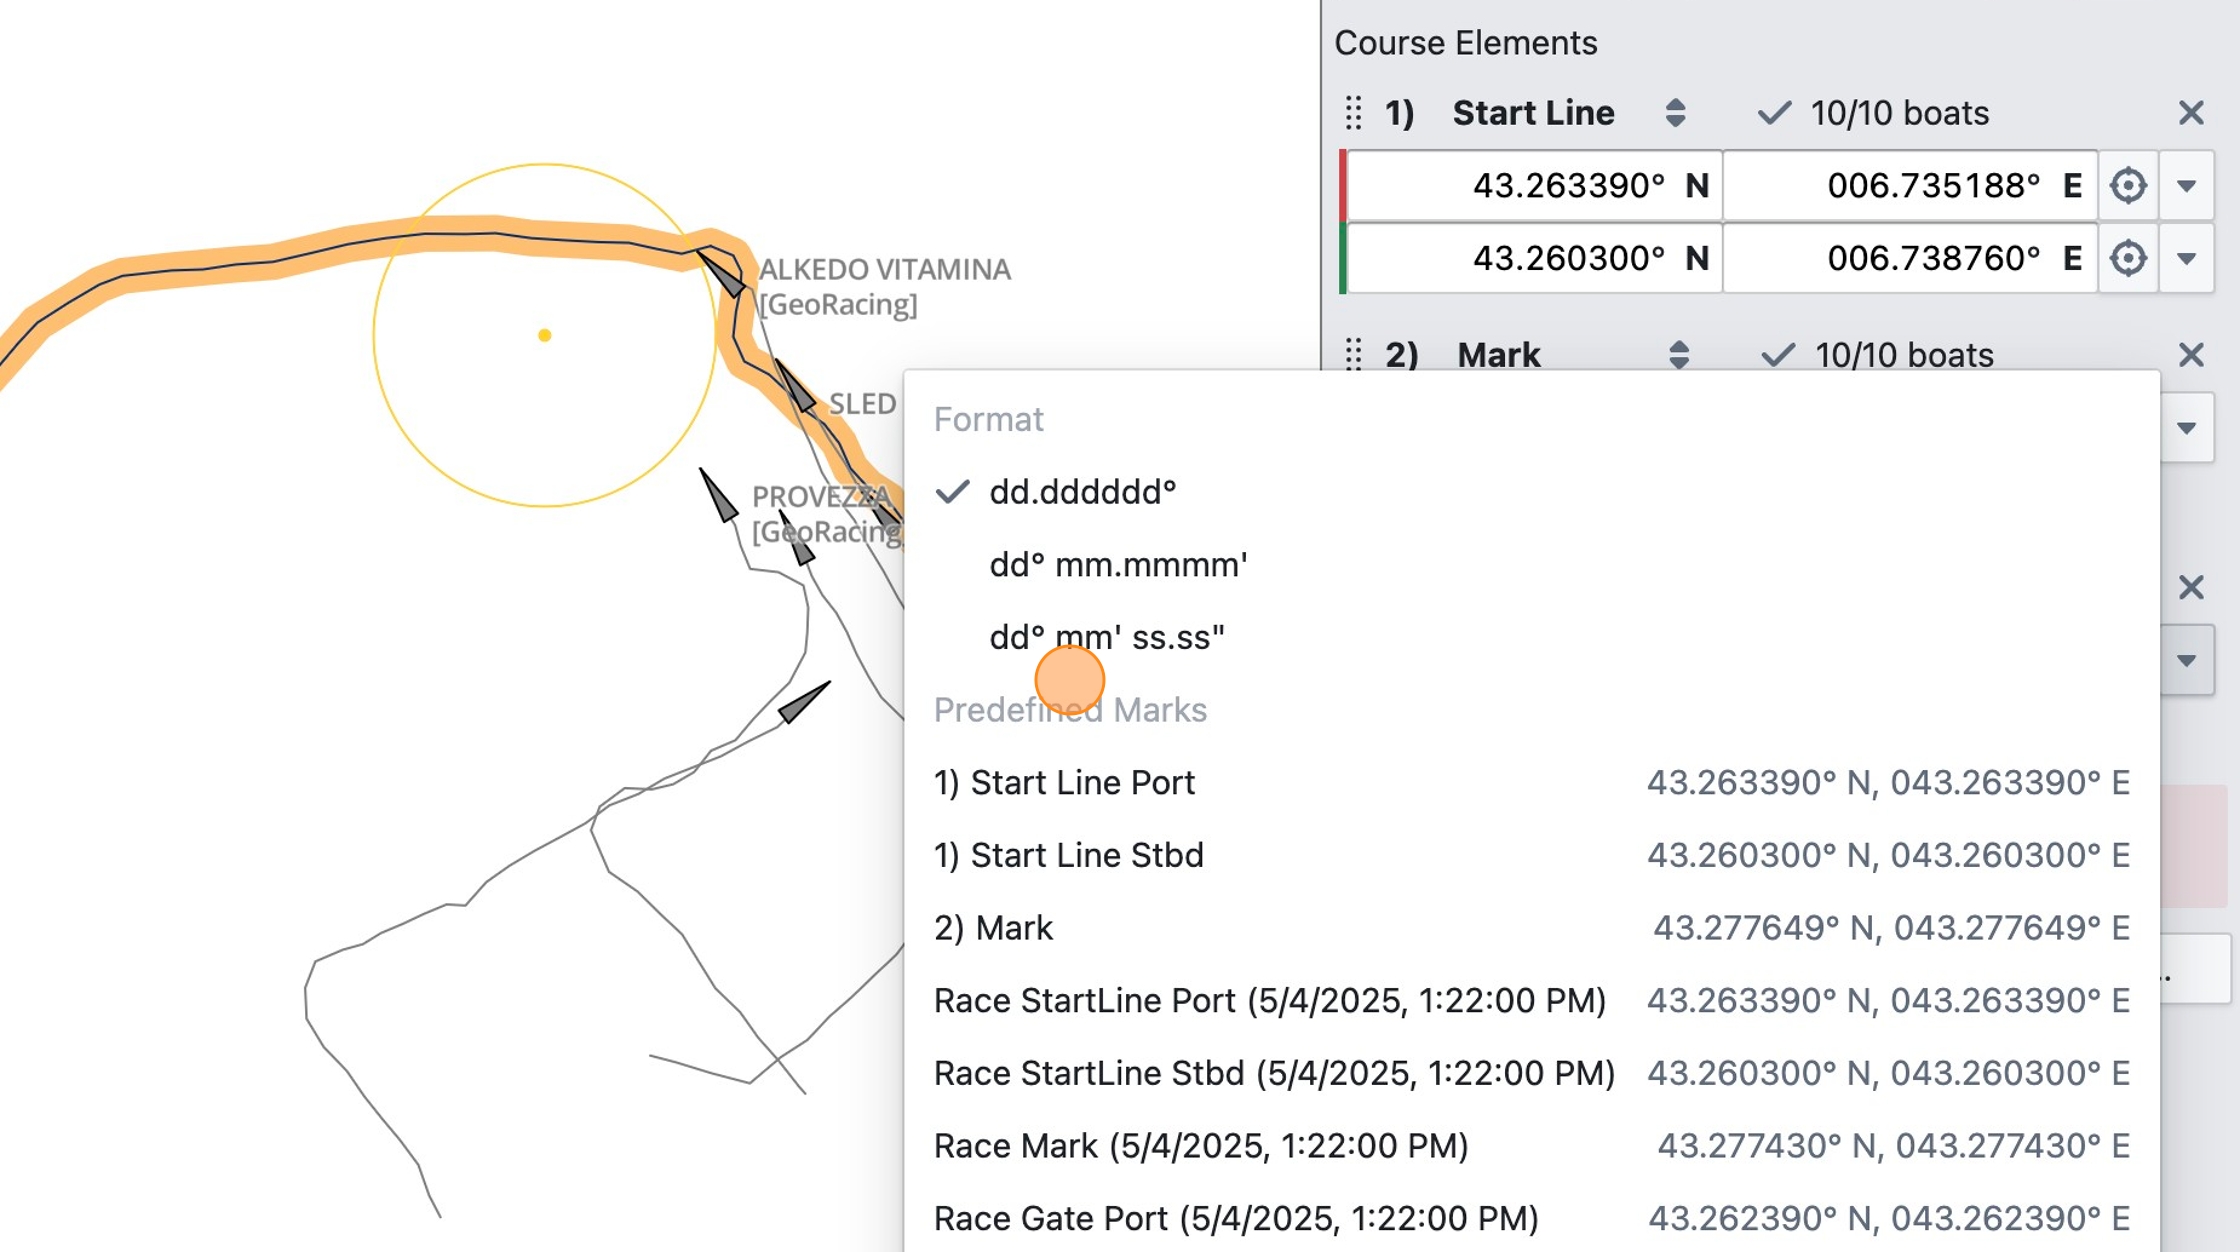
Step 13
Enter the coordinates of the start line. You can use the dropdown menu to select DD.DDD, DD MM.M or DD MM SS format for the coordinates
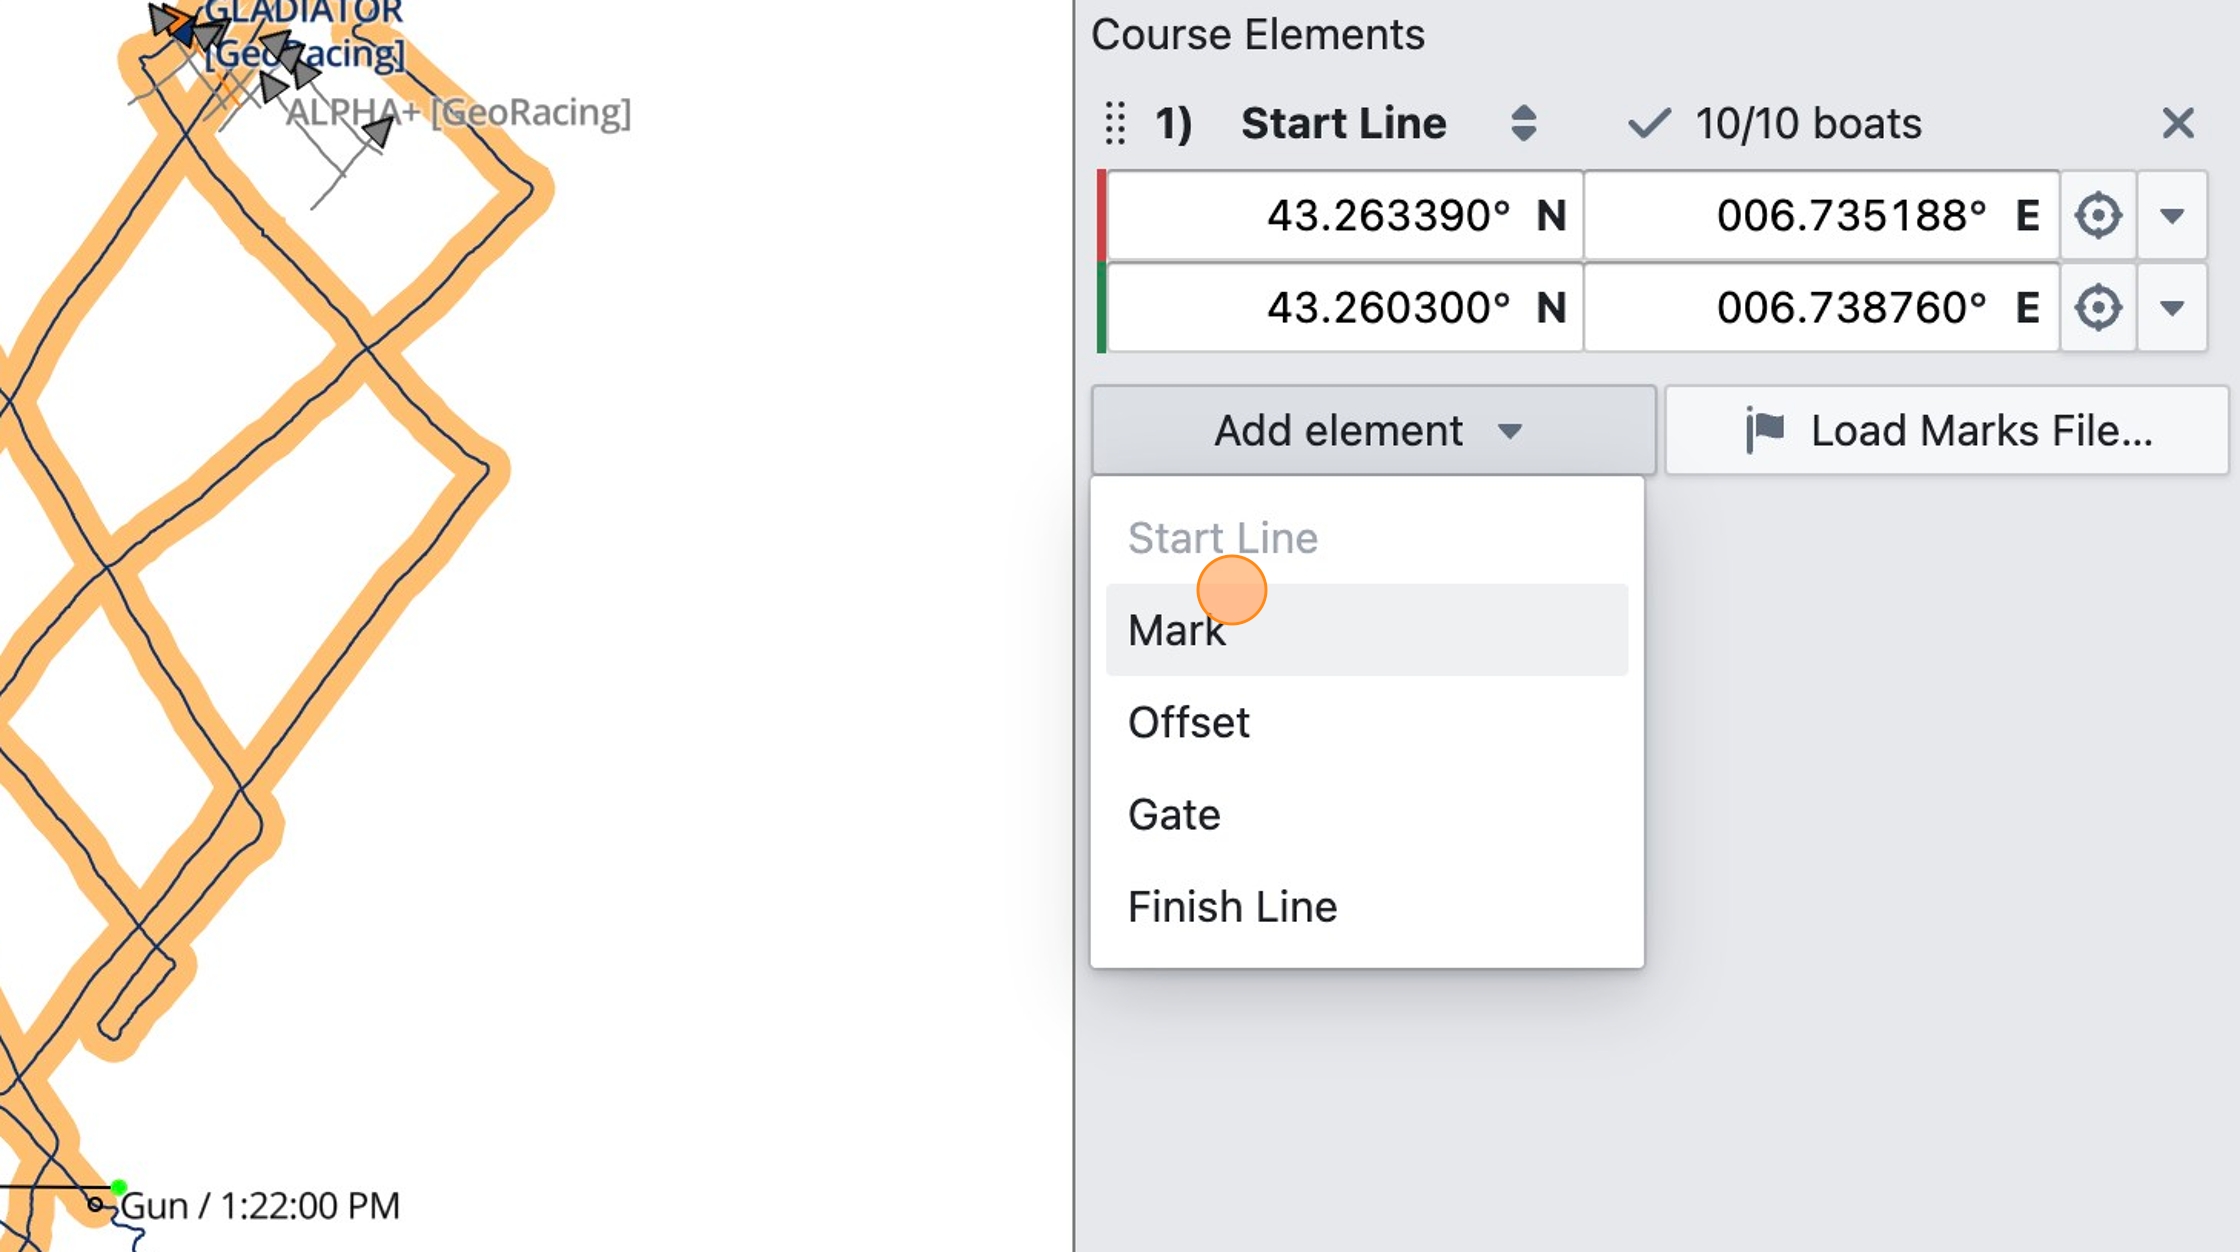
Step 14
Click "Add element" again and select "Mark" to add a top mark
Step 15
For another method of defining the course element's coordinate, click on the crosshair button
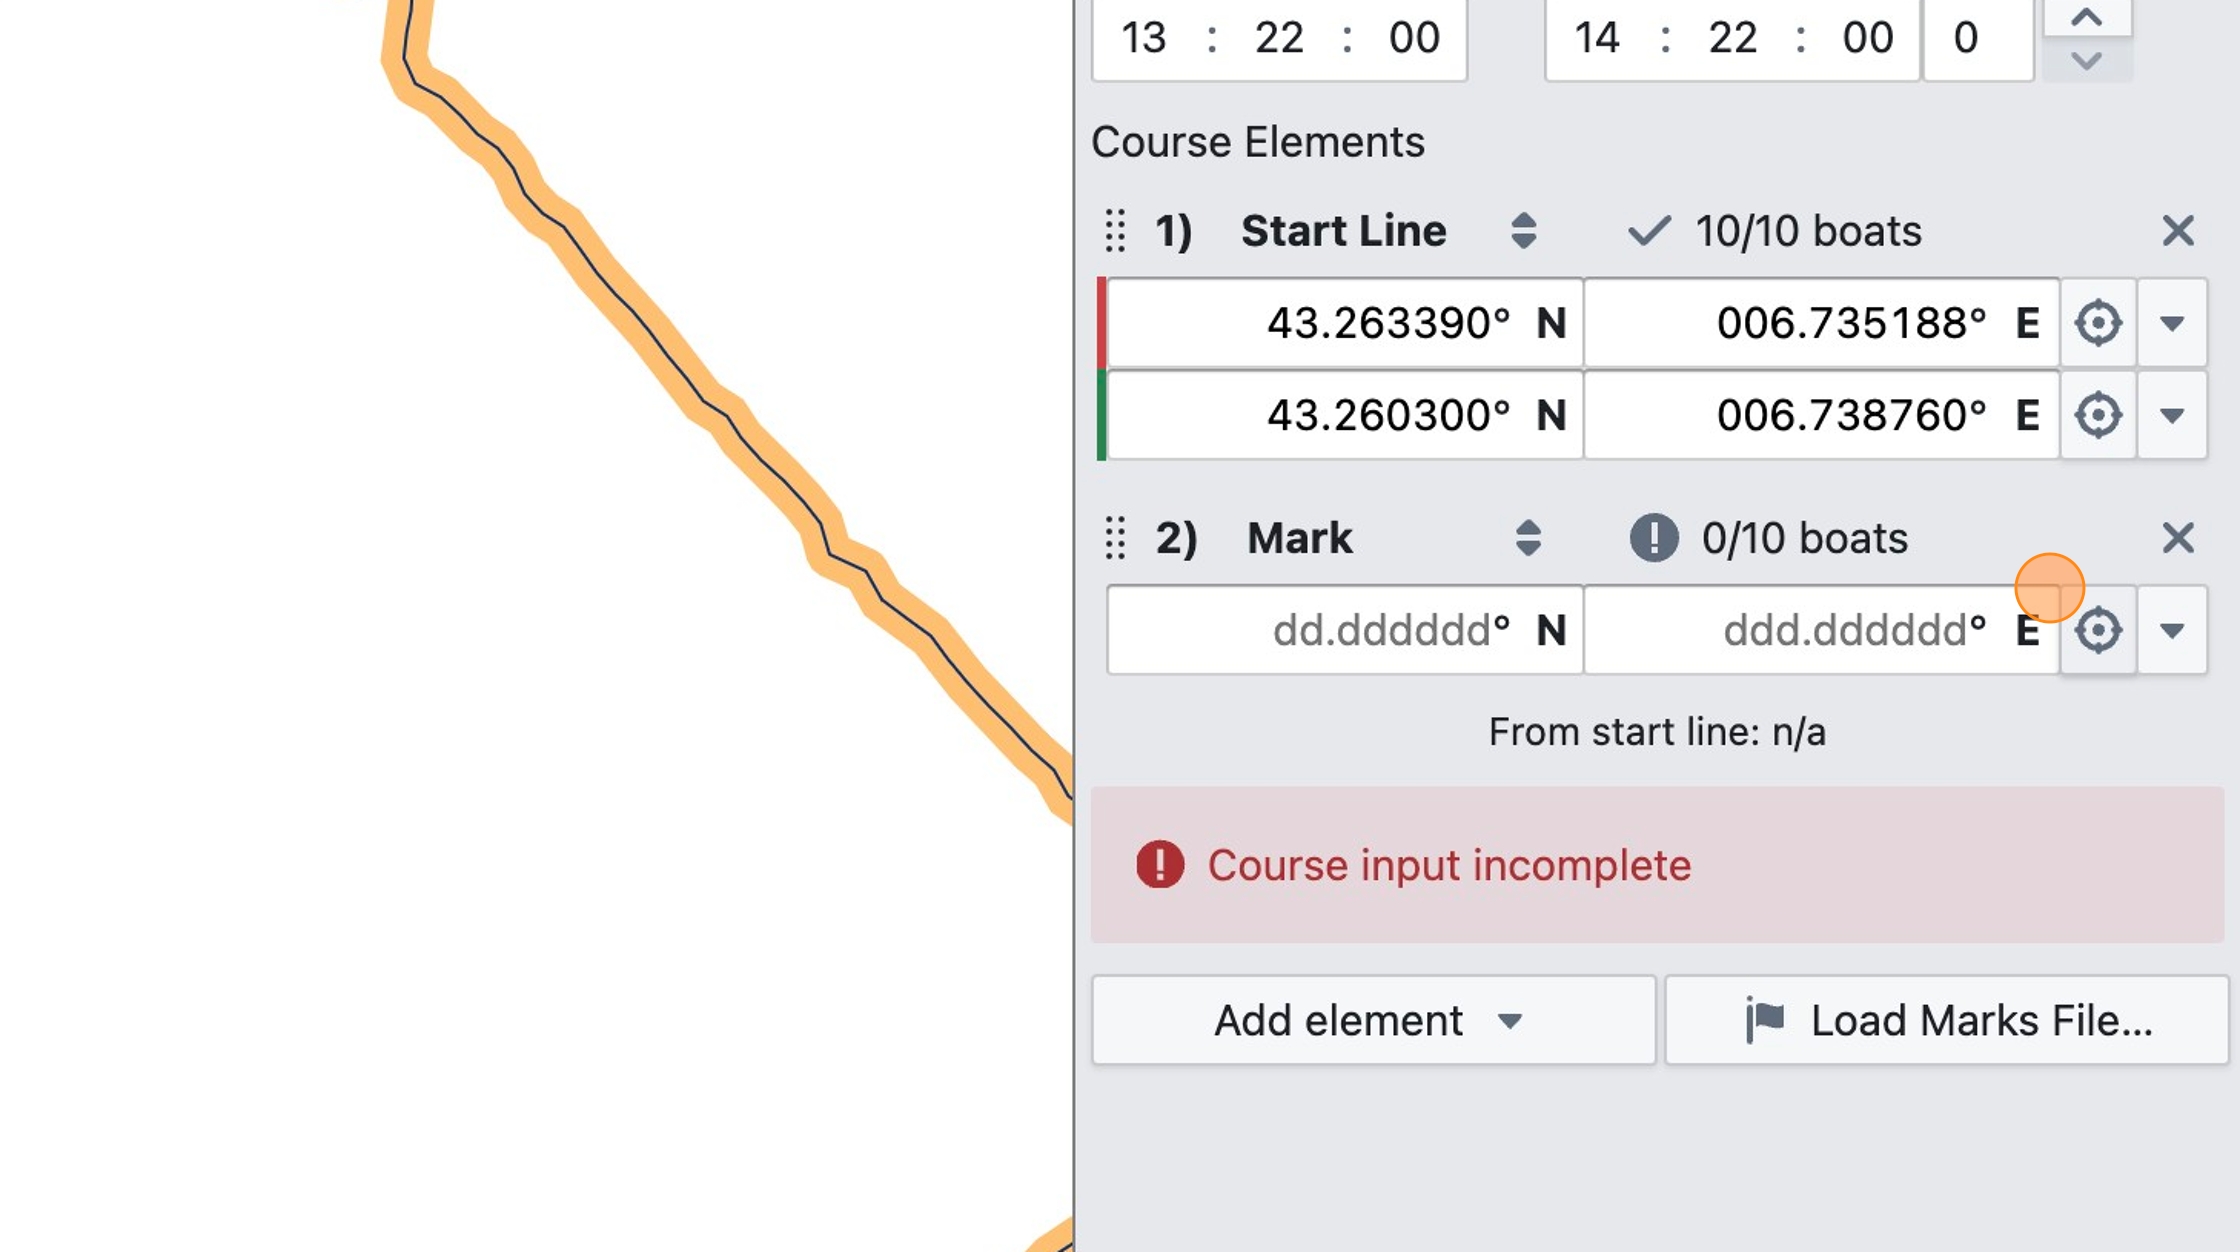
Step 16
Then seek to the relevant time, and click on the map to place the course element, using the boat's tracks as a reference. This works best for marks or gates, where mainly the rounding time is of interest, it will be a bit less accurate for start lines where you are less likely to get reliable "below line" numbers with a hand-placed line.
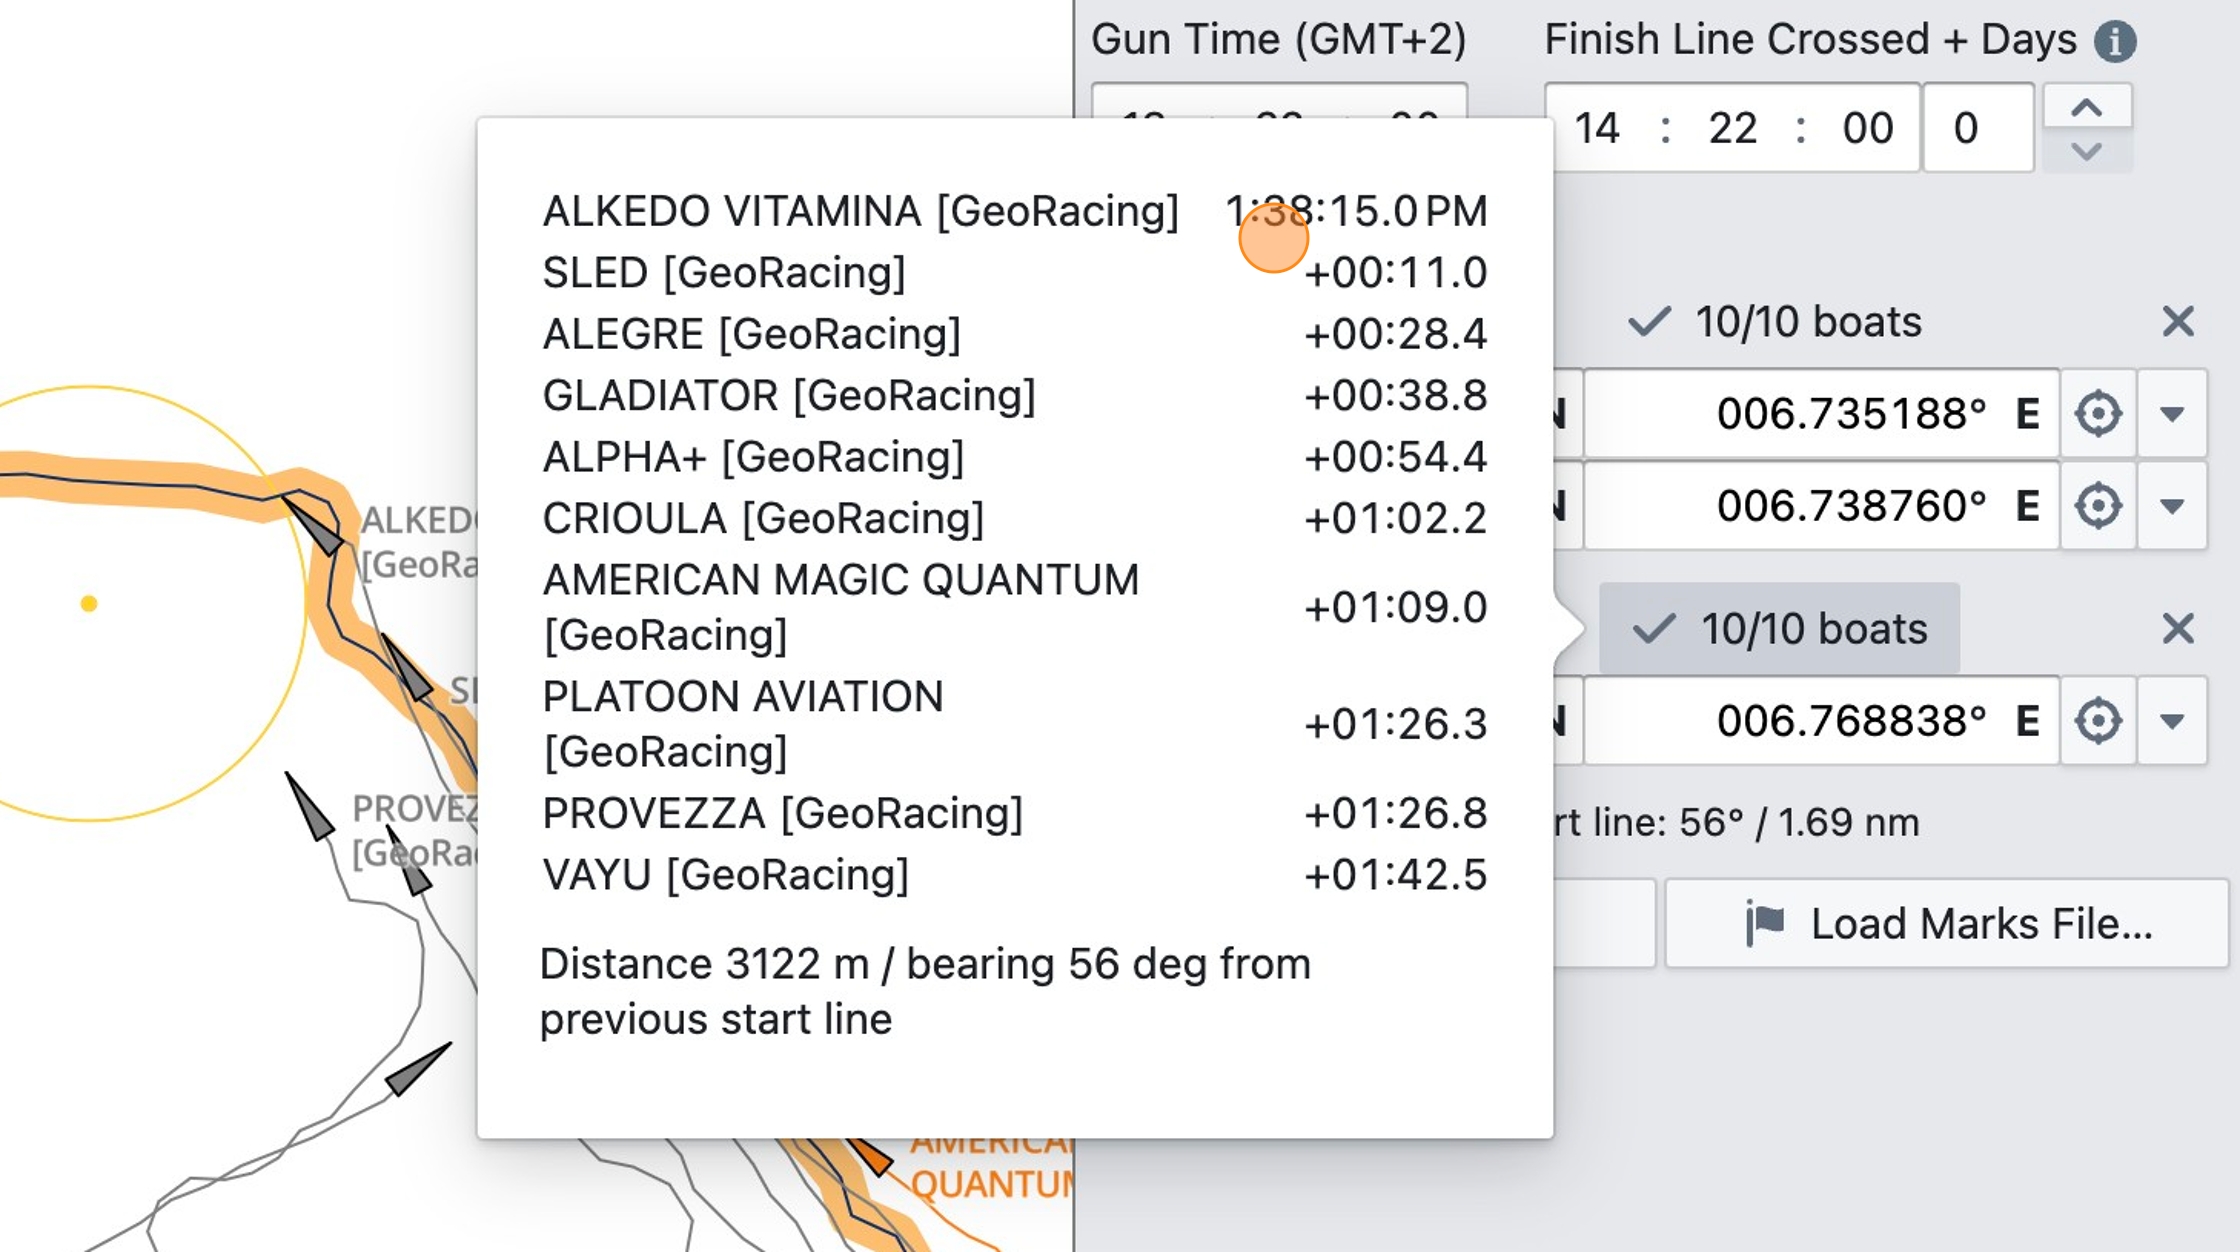
Step 17
Click on the "x/x boats" button to see if you placed the course element correctly and the rounding/crossing of all boats is detected at the correct time
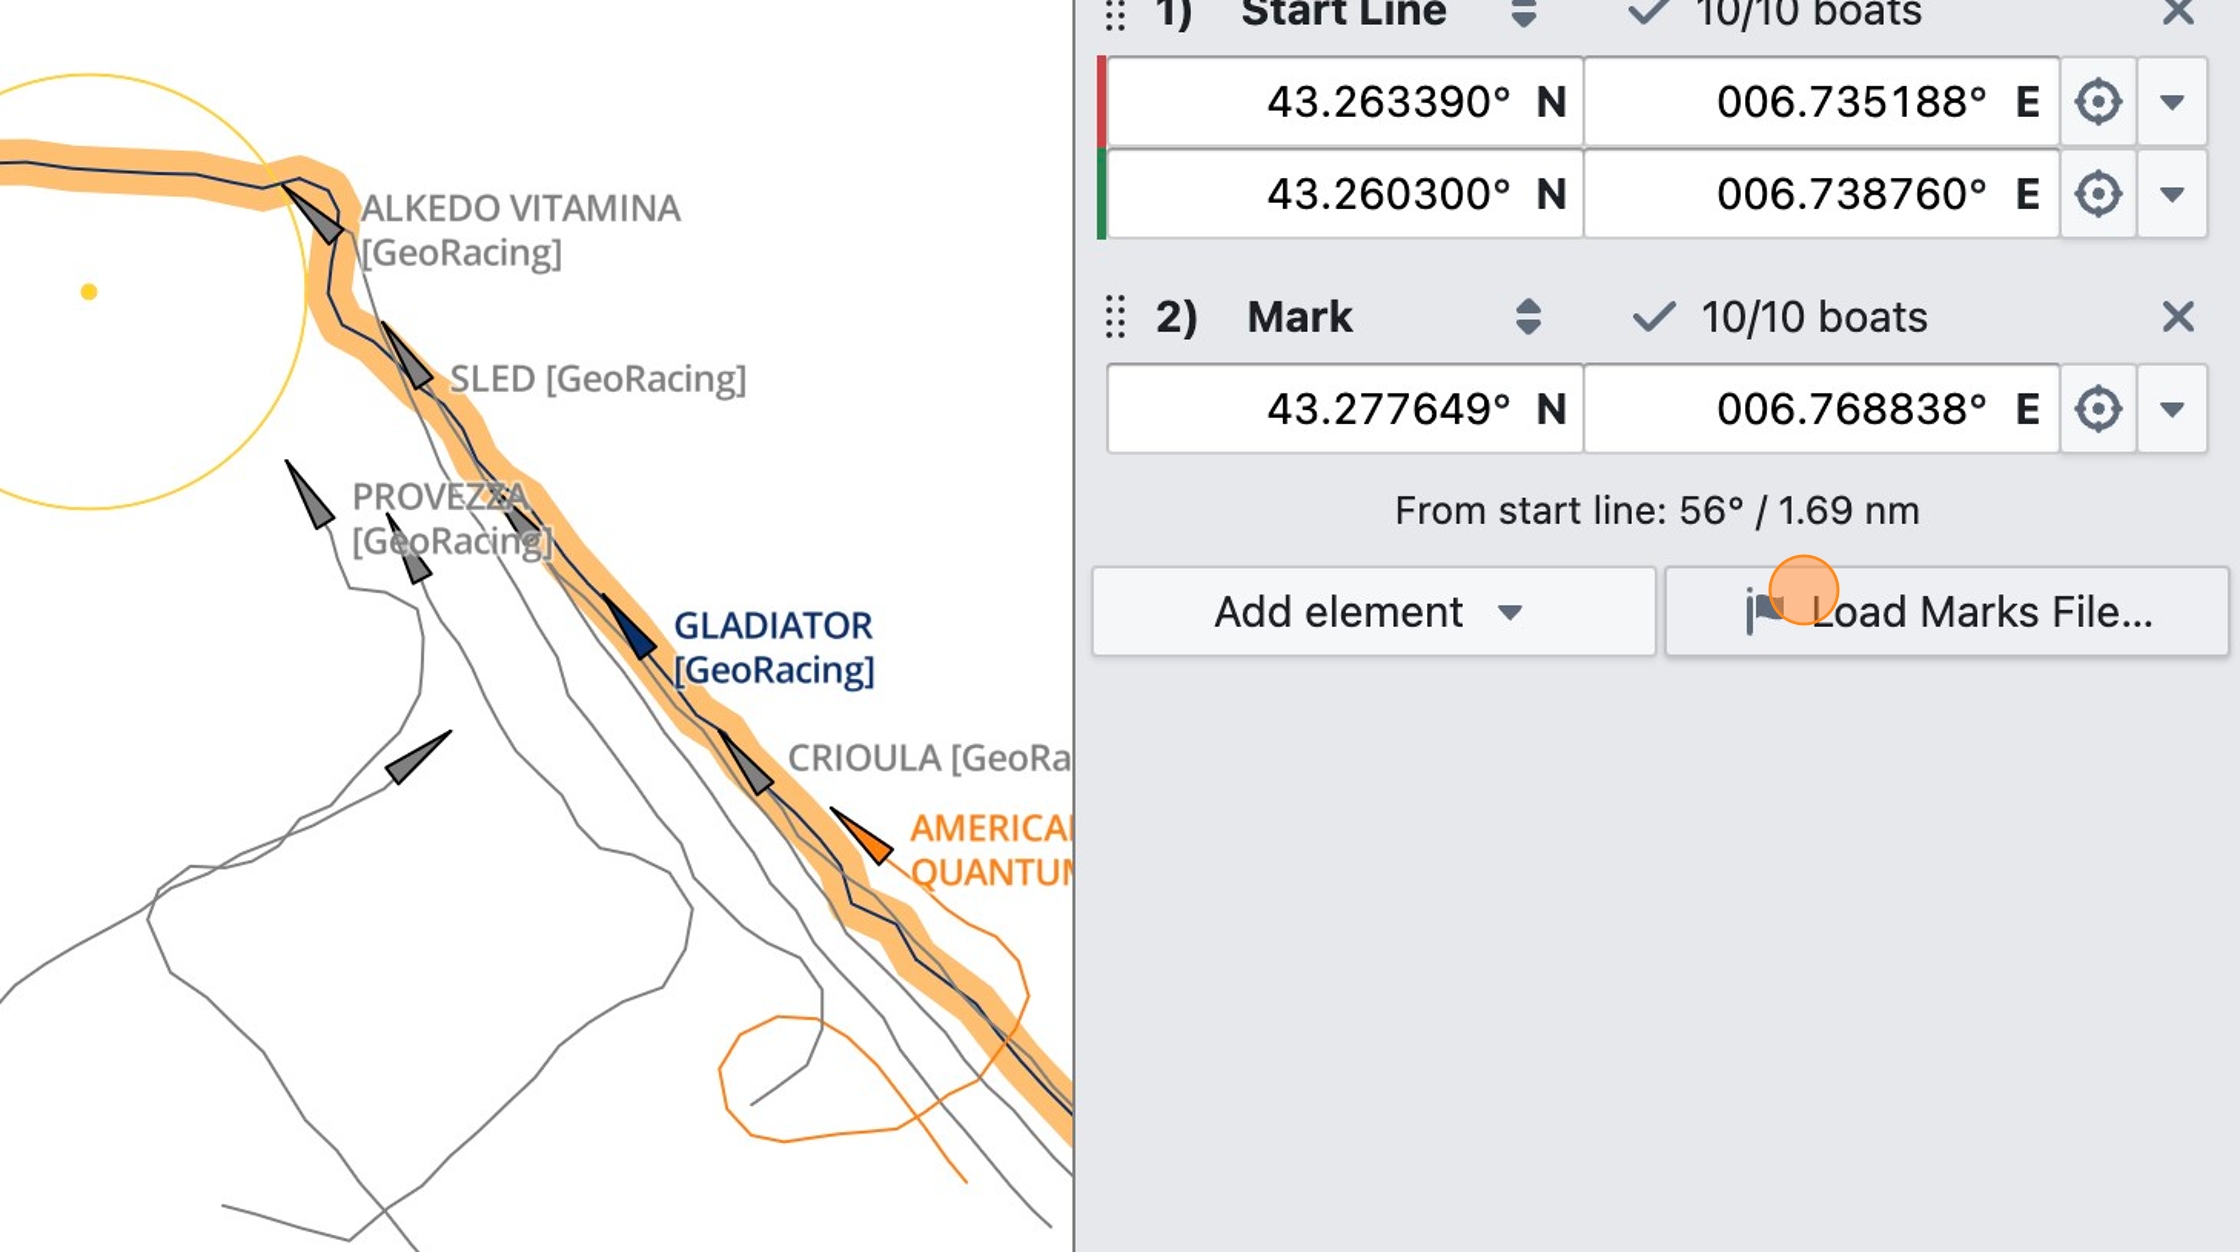
Step 18
If you have pinged the line or other marks using a GPS and you have a file with those marks, click "Load Marks File…" to use this file for coordinate input. See the "Start/Course Files" section at https://www.sailnjord.com/data-sources/ for supported file formats.
Step 19
Once you have loaded a suitable file, coordinates will appeat under "Predefined Marks" in the dropdown menu of each coordinate input field
Analytics Visualization Types
Njord Analytics offers a variety of different visualization types which are available in different contexts, depending on the required data and the nature of the visualization.


Table

Available In Entire Day, individual races/trainings
Displays a tabular view showing data at configurable time intervals.
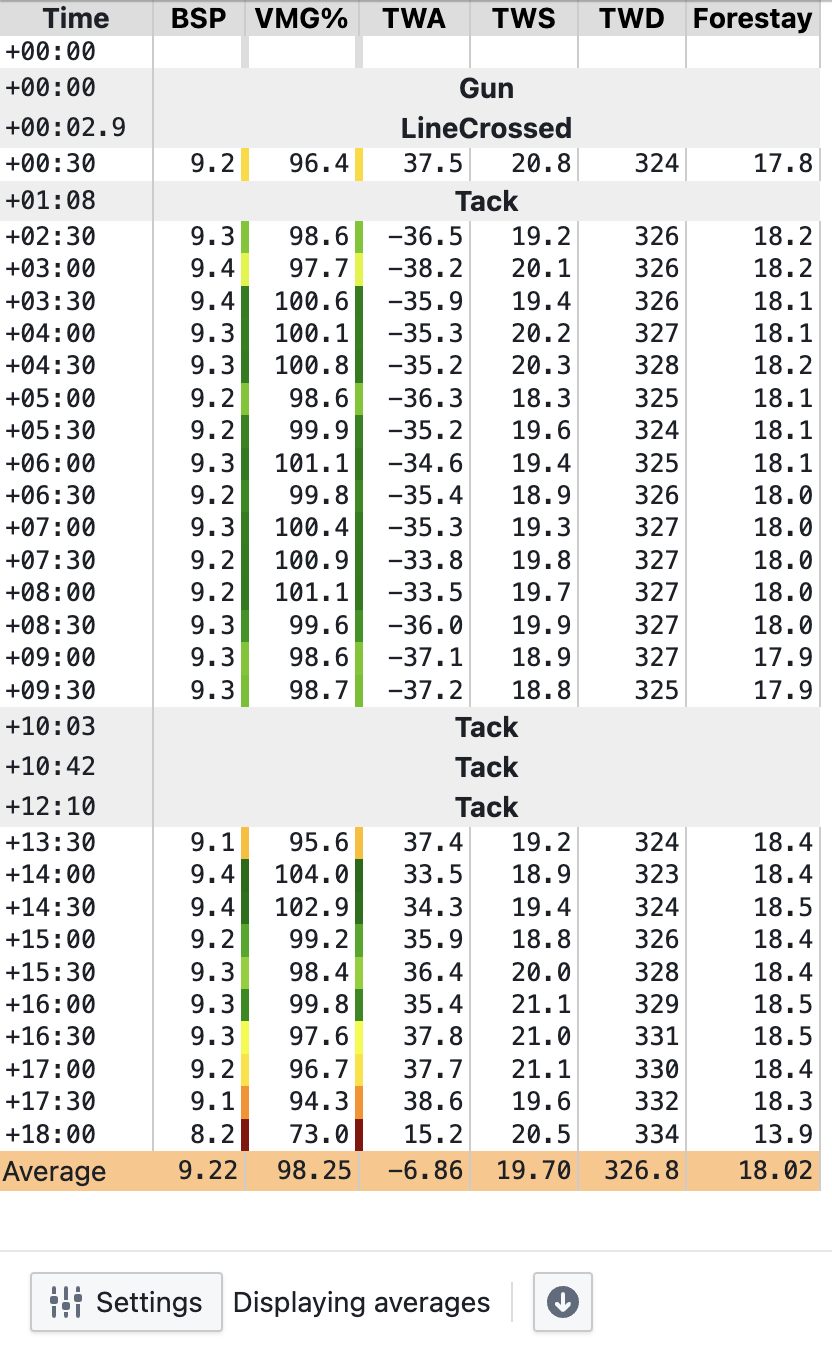
Table Configuration Options
- Interval: determines the time interval of rows displayed in the table; starting at the start time of the selected race, training or day.
- Displayed Metrics: determines the columns displayed in the table
- Show Averages: when selected, displays the average (mean) of values in the interval preceding each row's timestamp. Otherwise, the momentary value at each row's timestamp is displayed (using interpolation, if required).
- Exclude Maneuvers: when selected, excludes data before and after maneuvers (configurable in the boat's filter settings).
- Show Annotation Rows: when selected, shows events such as maneuvers, or start line crossings, in the table
- Show Sails Column: when selected, adds a column to the table showing the hoisted sails at each time (Display Momentary Values) or in each row's time interval (Display Averages)
Line Chart

Available In Entire Day, individual races/trainings
Displays a line chart (strip chart) of one or more metrics for the selected time range.
Where targets are available, they are automatically shown as a grey line together with the the main variable (e.g. BoatSpeed and TargetBoatSpeed).
Hover over the chart to highlight a point in time and get an instant reading at that time.
Click and drag on the chart area to create one or more highlighted time ranges. An instant average is shown. Click the save icon at the bottom of the area to save the highlighted time range as a new training.
Click on the +/- buttons or use the slider at the bottom of the view to zoom into the chart.
Note that for bearing metrics like TWD, COG, or Heading, a continuous line is drawn where the value wraps around 0/360 degrees. The Y axis may span more than 360 degrees in case of multiple consecutive "turns" of the bearing value.
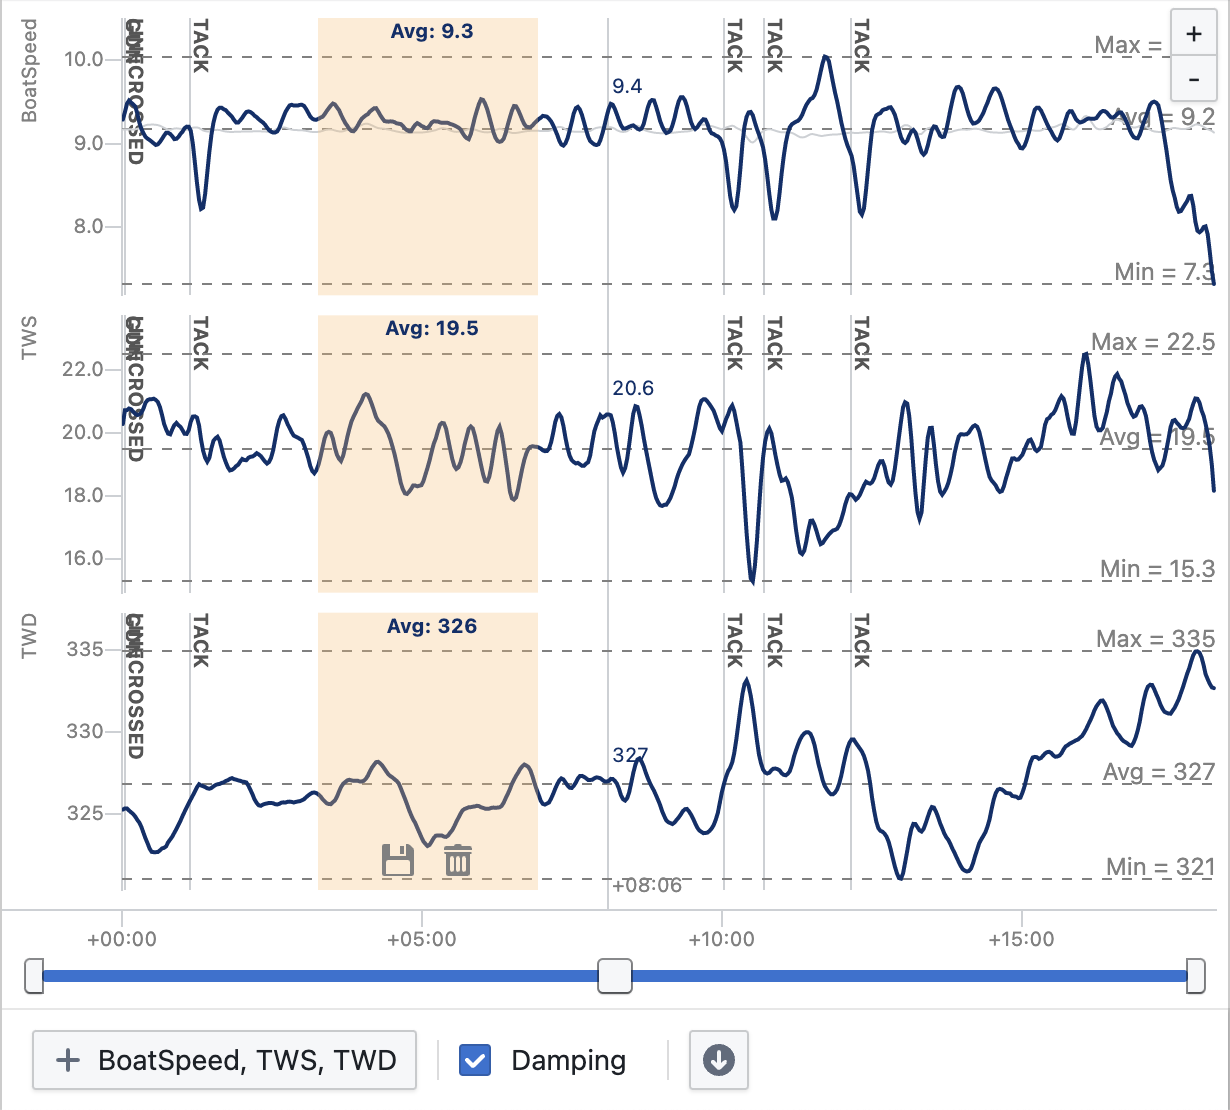
Line Chart Configuration Options
- Select one or more metrics, which will be shown as a vertical stack of individual line charts
- Damping: applies damping to the data with a damping/moving average window size of 1/100th of the displayed time range.
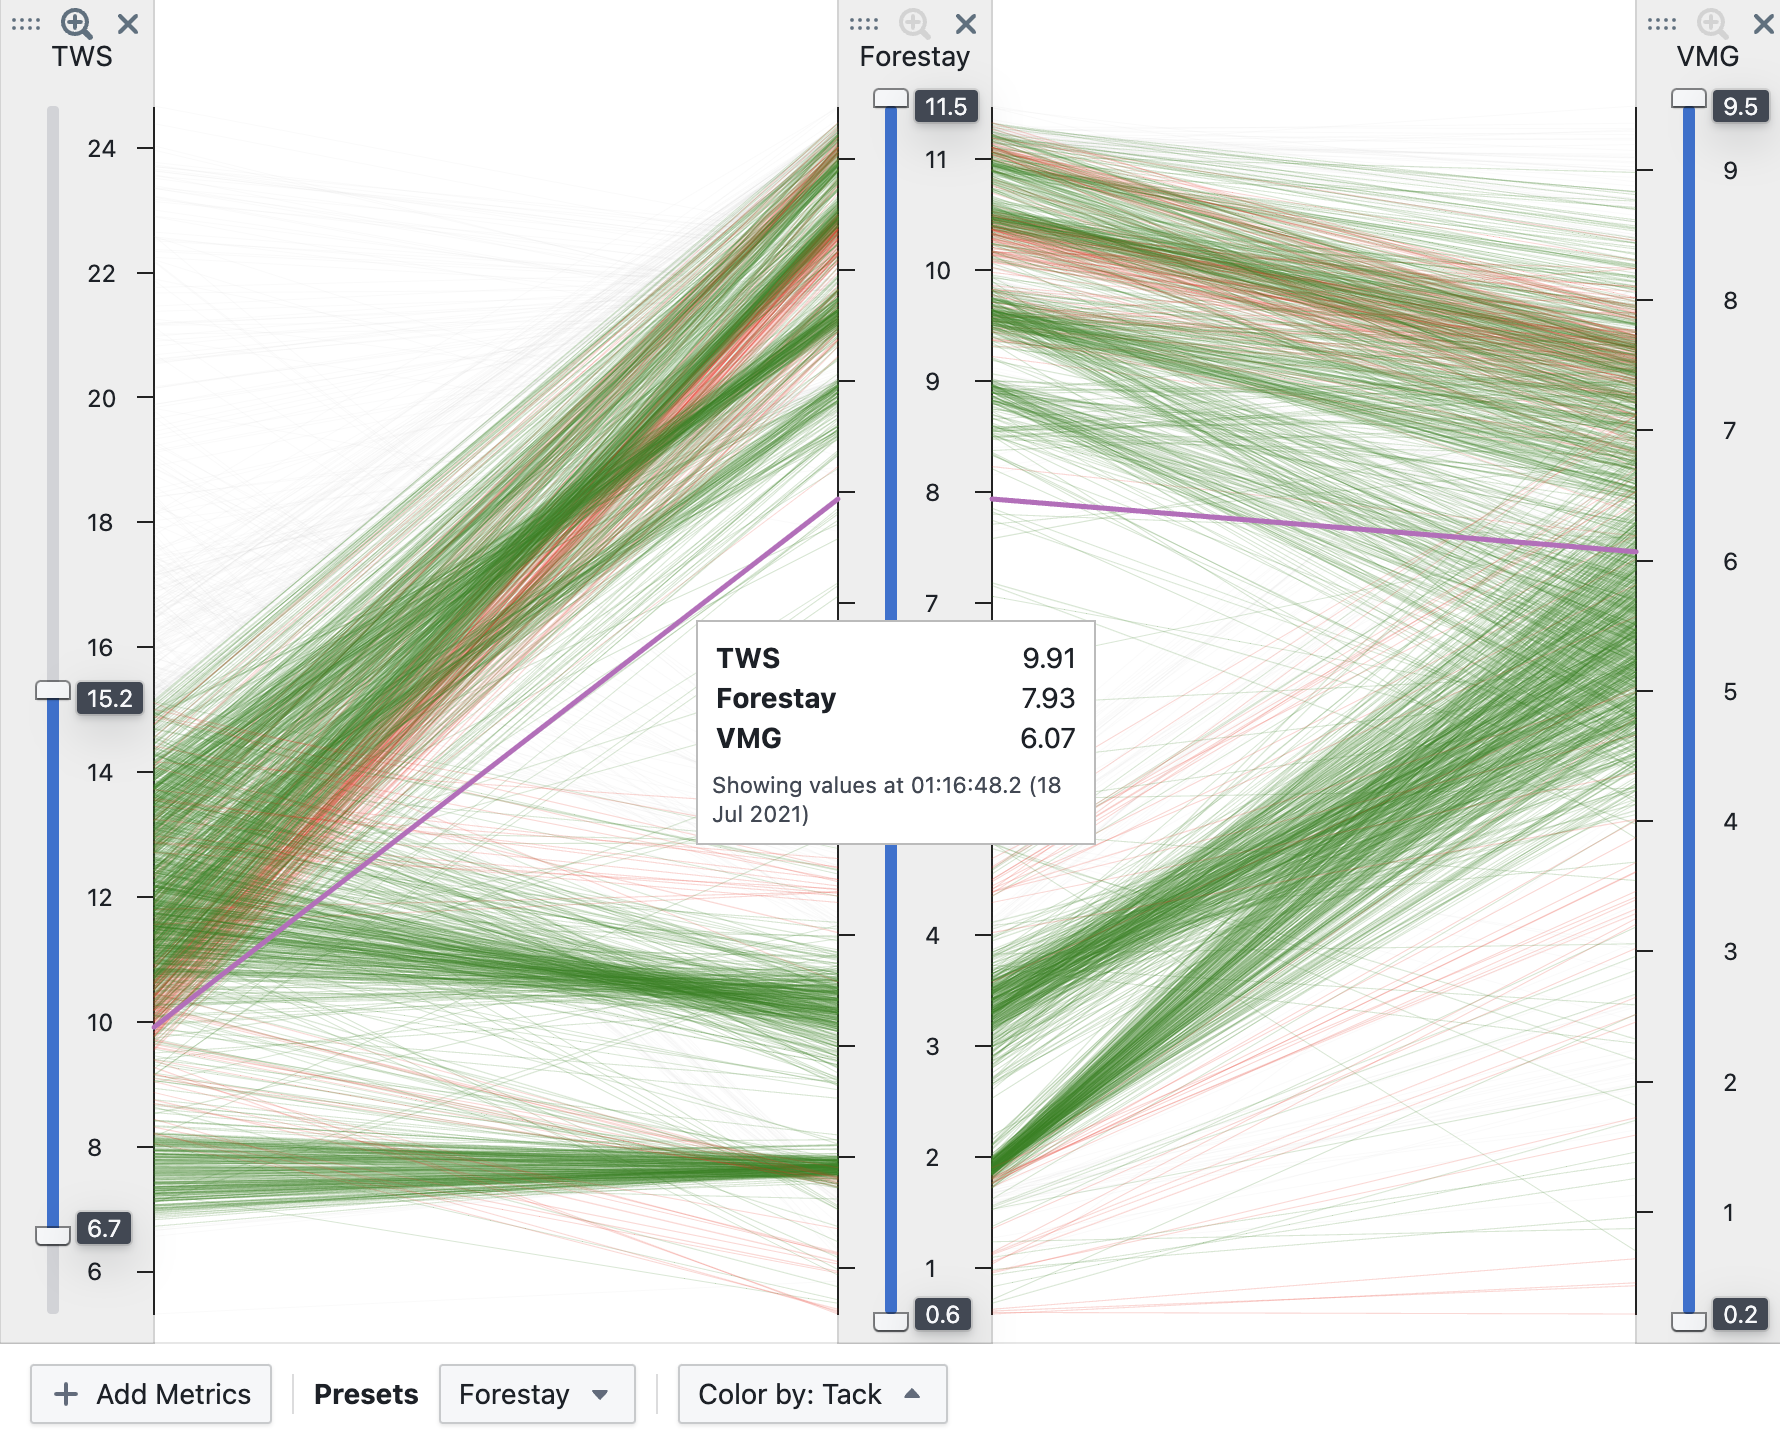
Scatter Chart

Available In Entire Day, Only Races, Aggregate all Dates in Event, individual races/trainings, Performance Database
Displays a scatter chart (X/Y chart) plotting data points by two selected metrics (X and Y axis).
In all modes except the performance database, data is automatically averaged into phases of a specific duration, to achieve a reasonable number of datapoints in the chart.
Hover over a data point to see a tooltip with exact values and the corresponding timestamp / phase duration.
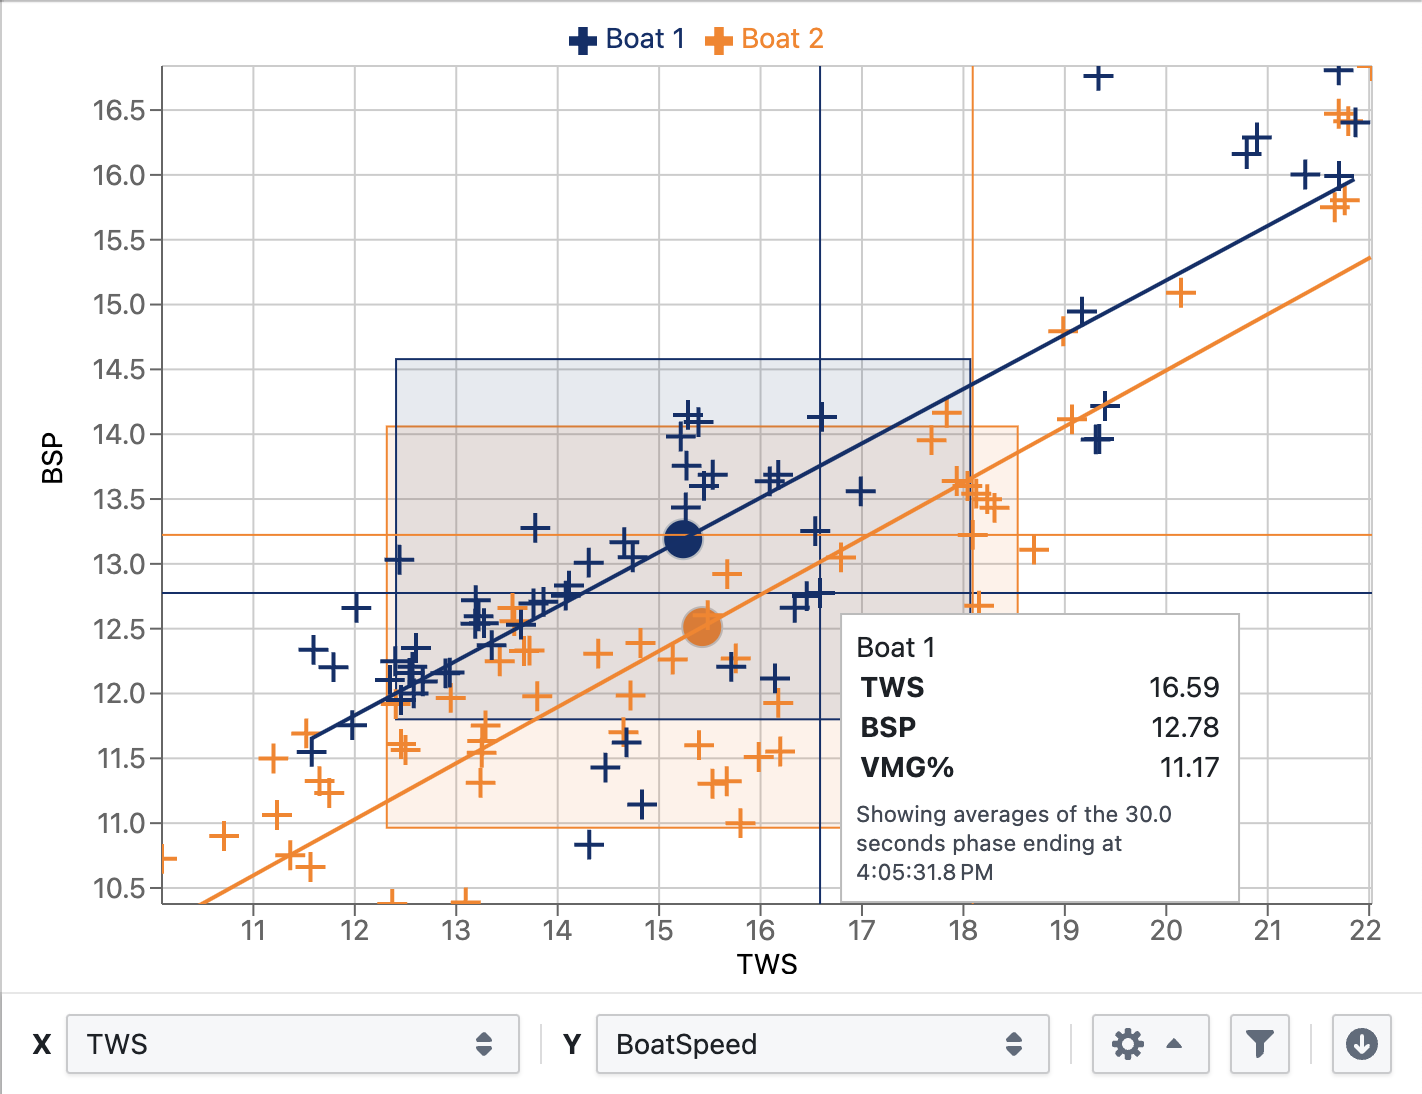
Scatter Chart Configuration Options
- X and Y metric: determine which metrics are used to plot points in the chart
- Phase Duration: how many seconds of data are averaged to form each data point
- Fit Curve: overlays a polynomial fit of the chosen order onto each data series, which may help indentify trends in a dataset or compare different datasets (port vs. starboard or different boats)
- Reference Areas: displays rectangles on the chart area representing the extent of data in each data series, using metrics selected for the X and Y axis, either up to the min/max of each series, or the mean of each series (displayed as a circle/dot) and spanning one standard deviation in each direction. This is especially useful for a quick visual comparison of multiple data series (boats)
- Targets: displays a purple line showing the targets for the chosen Y metric (select
TWSas the X metric). Targets can be either from the log file itself, or from a polar/targets configured for the boat. - Performance Database: adds data series for comparison from the boat's performance database
- Color by Tack: breaks down the data points into separate port/starboard data series for comparison
- Highlight Top VMG%: adds a yellow highlight to all data points whose VMG% (percentage of VMG target) lies within the top 10 percentiles of VMG% of the entire dataset
- Exclude Maneuvers: excludes any data points that lie before and after maneuvers (configurable in the boat's filter settings)
- Filter: define additional filters to narrow the data in the chart, e.g. to remove outliers that disturb the analysis
Map

Available In Entire Day, Only Races, Aggregate all Dates in Event, individual races/trainings
Shows the track of one or more selected boats and any marks of the race/leg on a map.
Use the highlight mode and click on a track twice to mark a time range. You can save this highlighted time range as a new training.
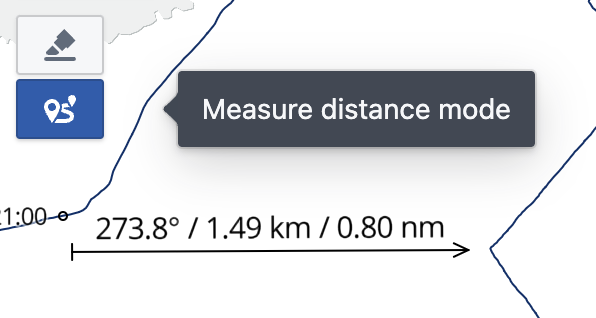
Use the distance measurement mode and click on the map twice to highlight and measure a distance and bearing.
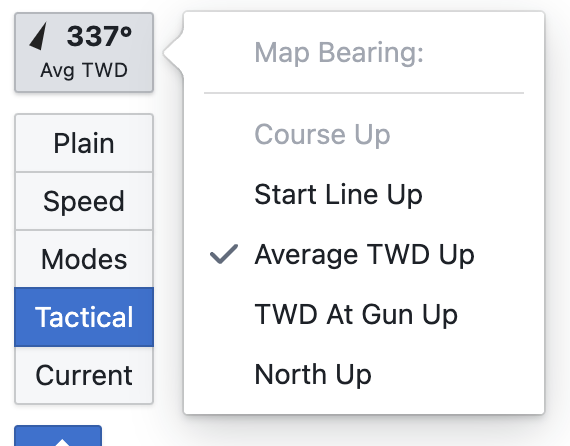
Click on the bearing control to select the "up" orientation of the map. Some options may not be available if either TWD data is missing or a race course has not been entered.
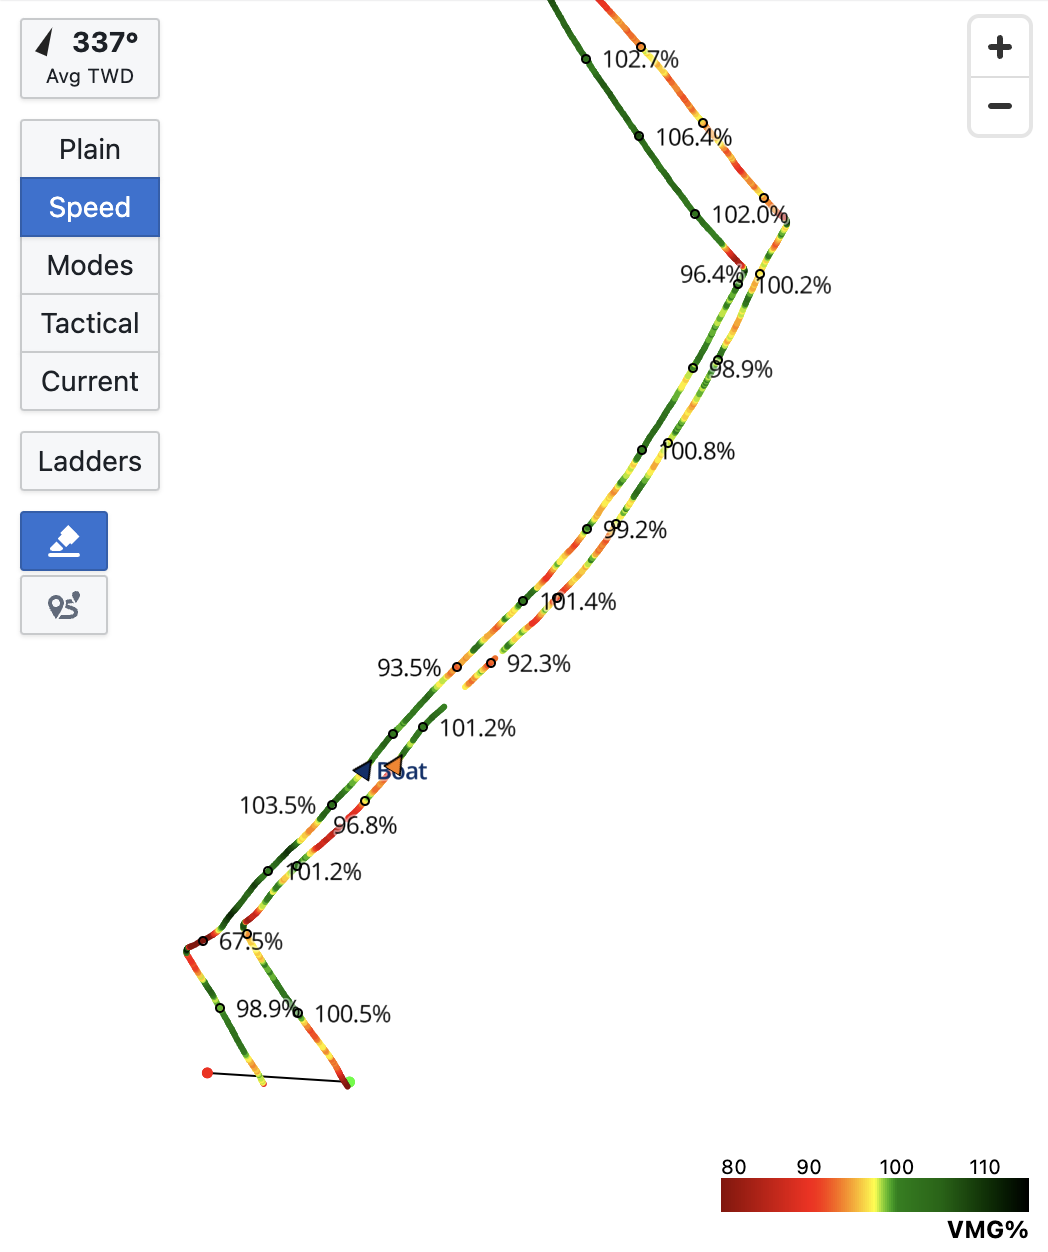
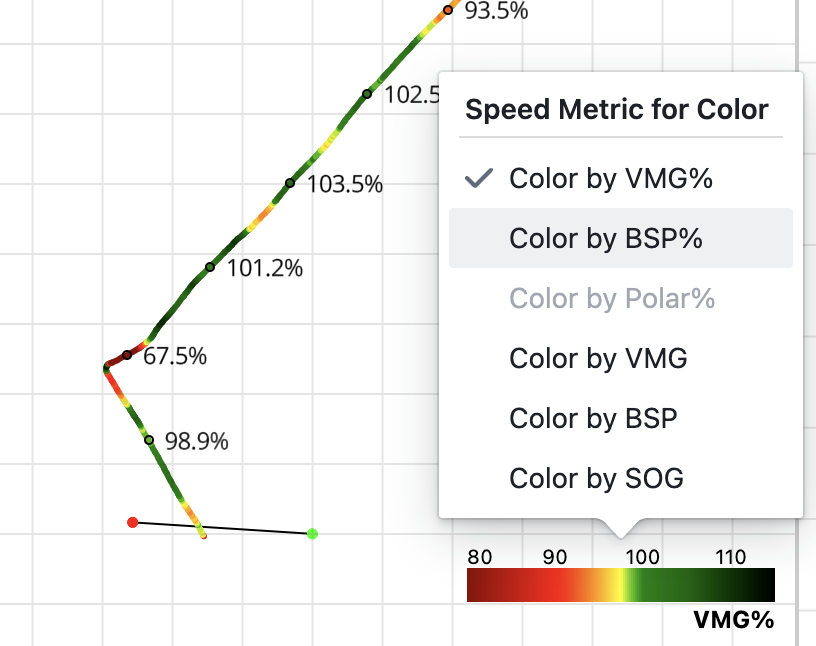
Map Mode: Speed
Click on the speed legend to change which metric is used to color the boat's track.
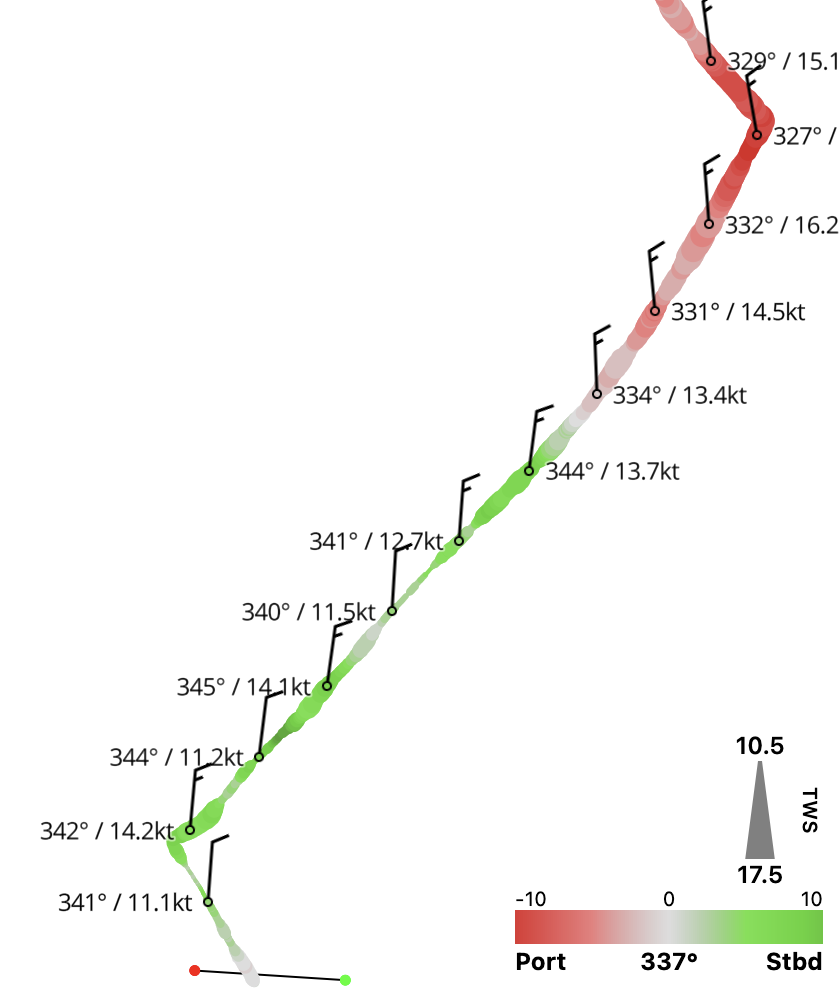
Map Mode: Tactical
In Tactical mode, the width of the track represents true wind speed (TWS, in the range shown in the legend, 10.5 to 17.5 kts in this example), and the color of the track represents shifts in true wind direction (TWD, around the average shown in the legend, 337 deg in this example).
Click on the color legend to select a coloring mode, either port/starboard or lifts/headers.
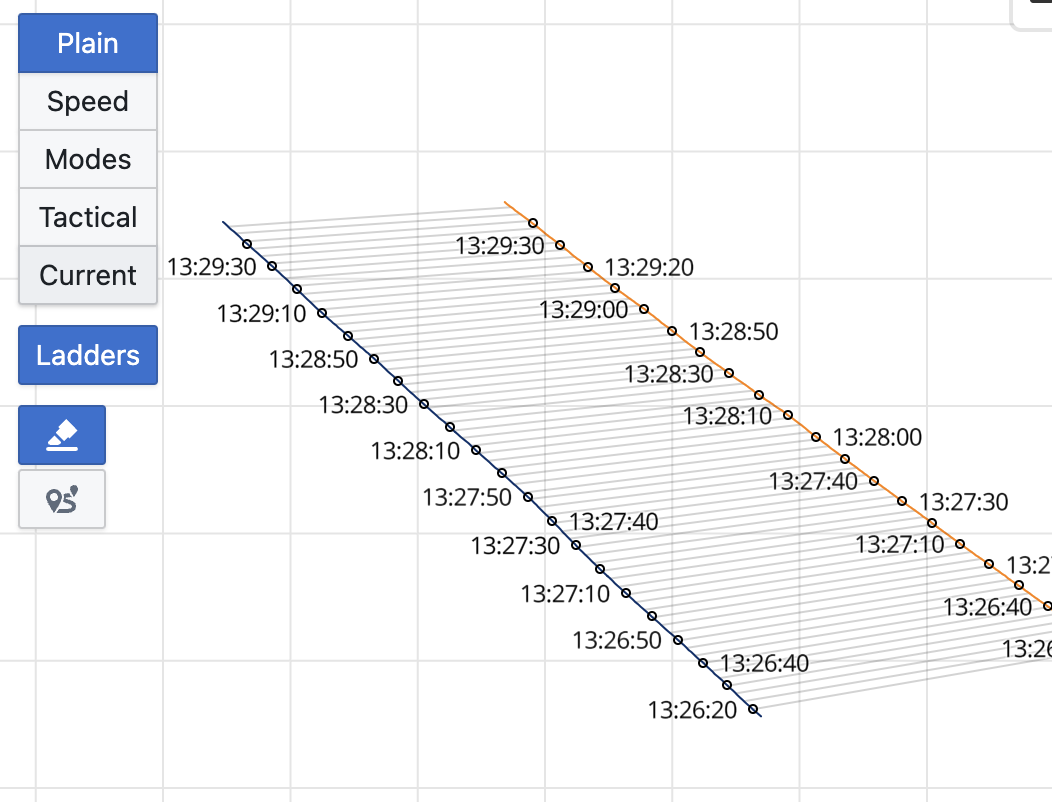
Map Tool: Ladders
When two boats are selected, click on the Ladders button to enable ladders between their tracks (connecting the boat's positions at equal times).
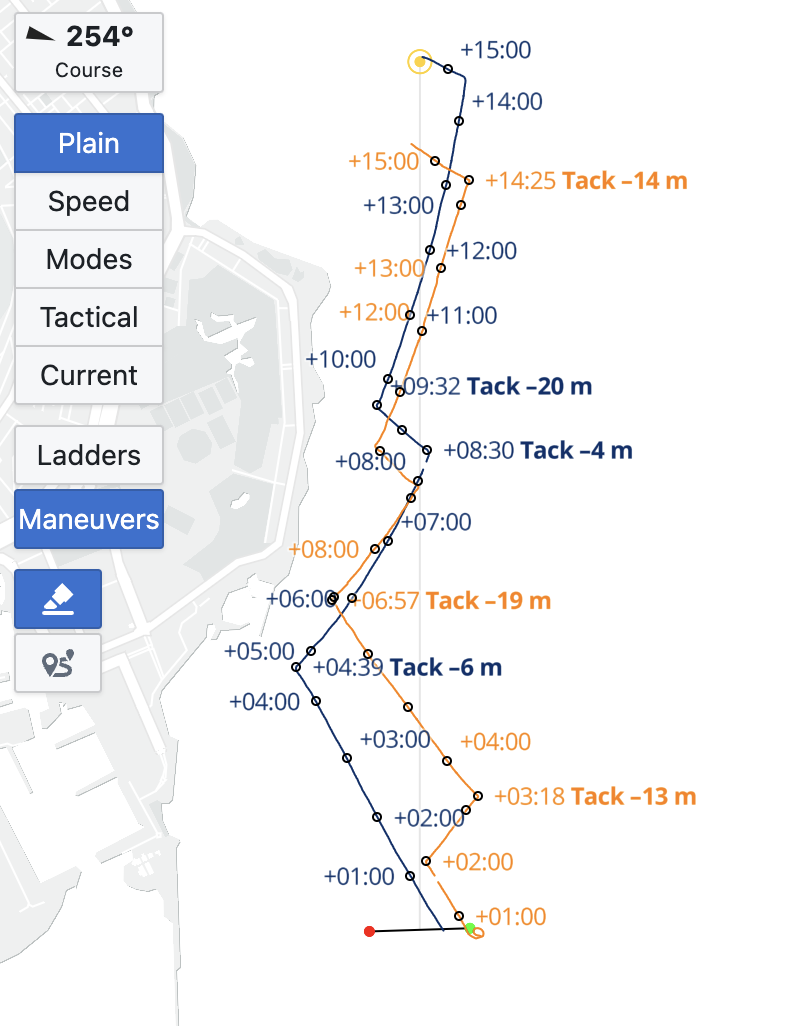
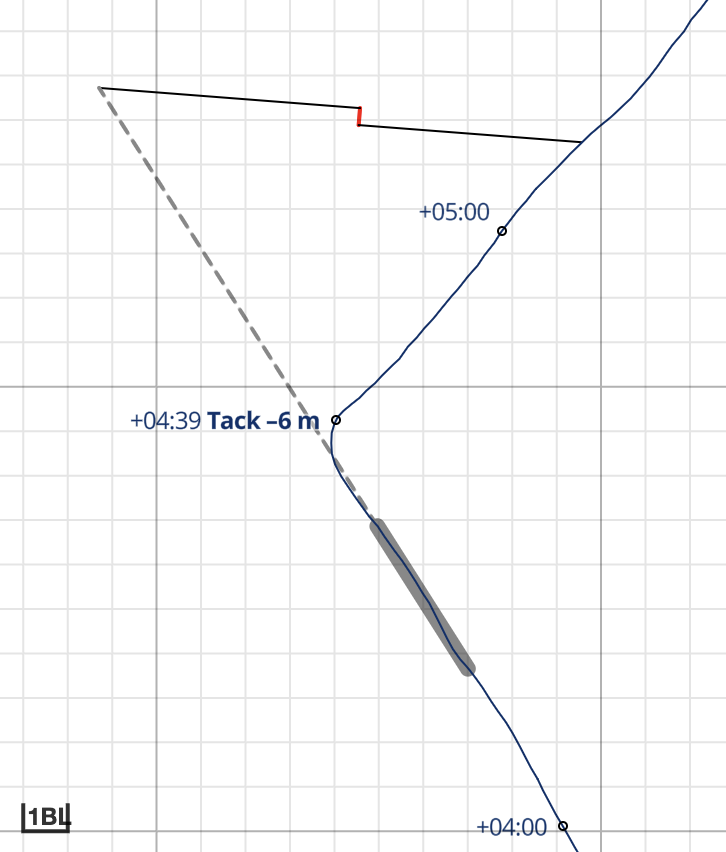
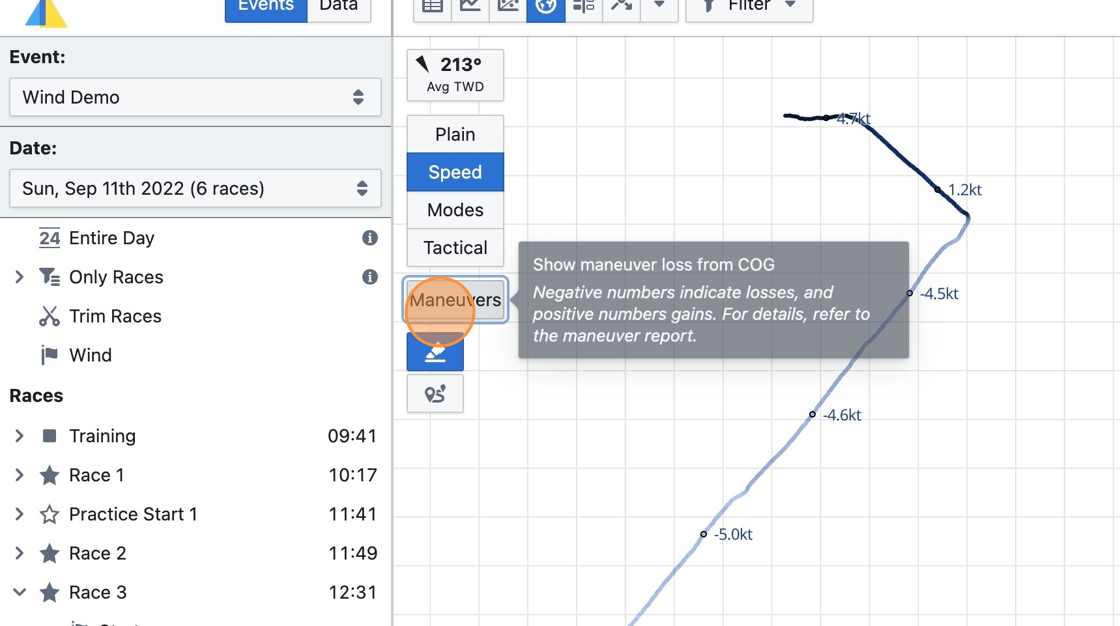
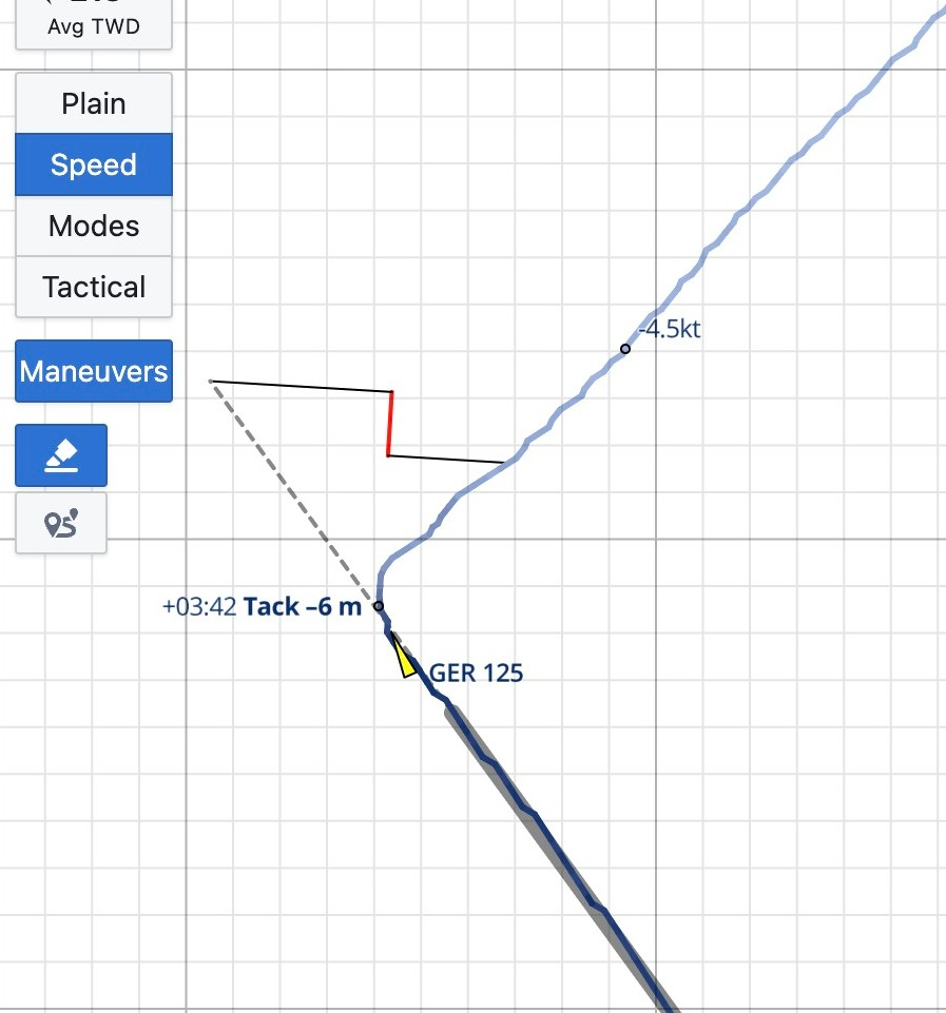
Map Tool: Maneuvers
Click on the Maneuvers button to show all analyzable maneuvers on the map, with maneuver loss calculated from average COG/SOG before the maneuver, and when zoomed in, a visualization of the loss calculation. Refer to the maneuver report for more details.
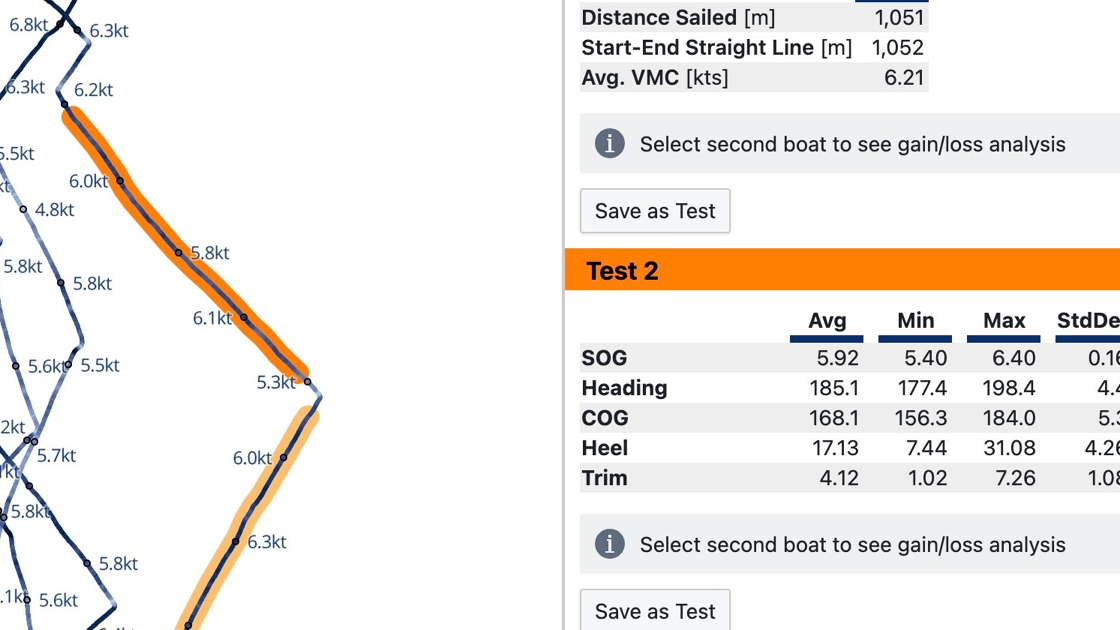
Statistics / Gain Loss

Available In Entire Day, Only Races, Aggregate all Dates in Event, individual races/trainings, Performance Database
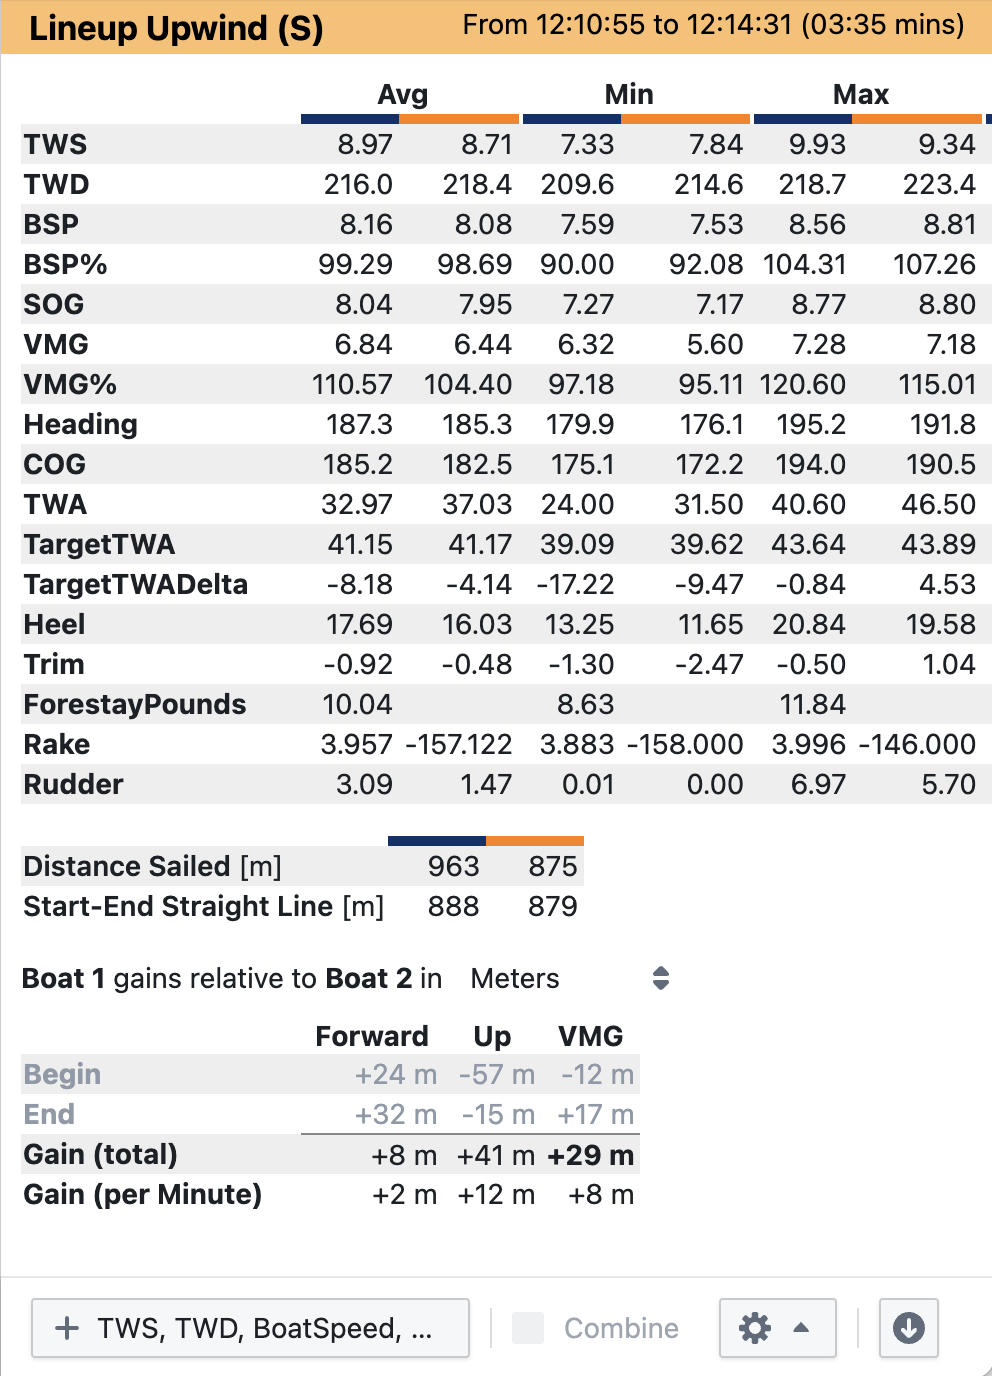
Displays detailed statistics for selected metrics (average/mean, minimum, maximum, and standard deviation - a measure of the amount of variation of a set of values).
Hover over a value in the Min or Max column to highlight the time when the minimum or maximum value occurred for the specific metric.
Supports comparing multiple boats (primary boat in blue, secondary boat in orange in this example).
Displays a gain/loss analysis for two boats for a selected time range (lineup). Gain is broken down into the forward direction (boat's heading), upward (perpendicular to forward direction), and the resulting gain (VMG, in TWD direction).
Check Combine when selecting multiple races or time ranges to view statistics for the combined data.
Uncheck Exclude maneuvers (settings menu) to include data before/after maneuvers in the statistics.
Targets

Available In Only Races, Aggregate all Dates in Event, individual races/trainings, Performance Database, Entire Day
Requires True wind speed (TWS) data
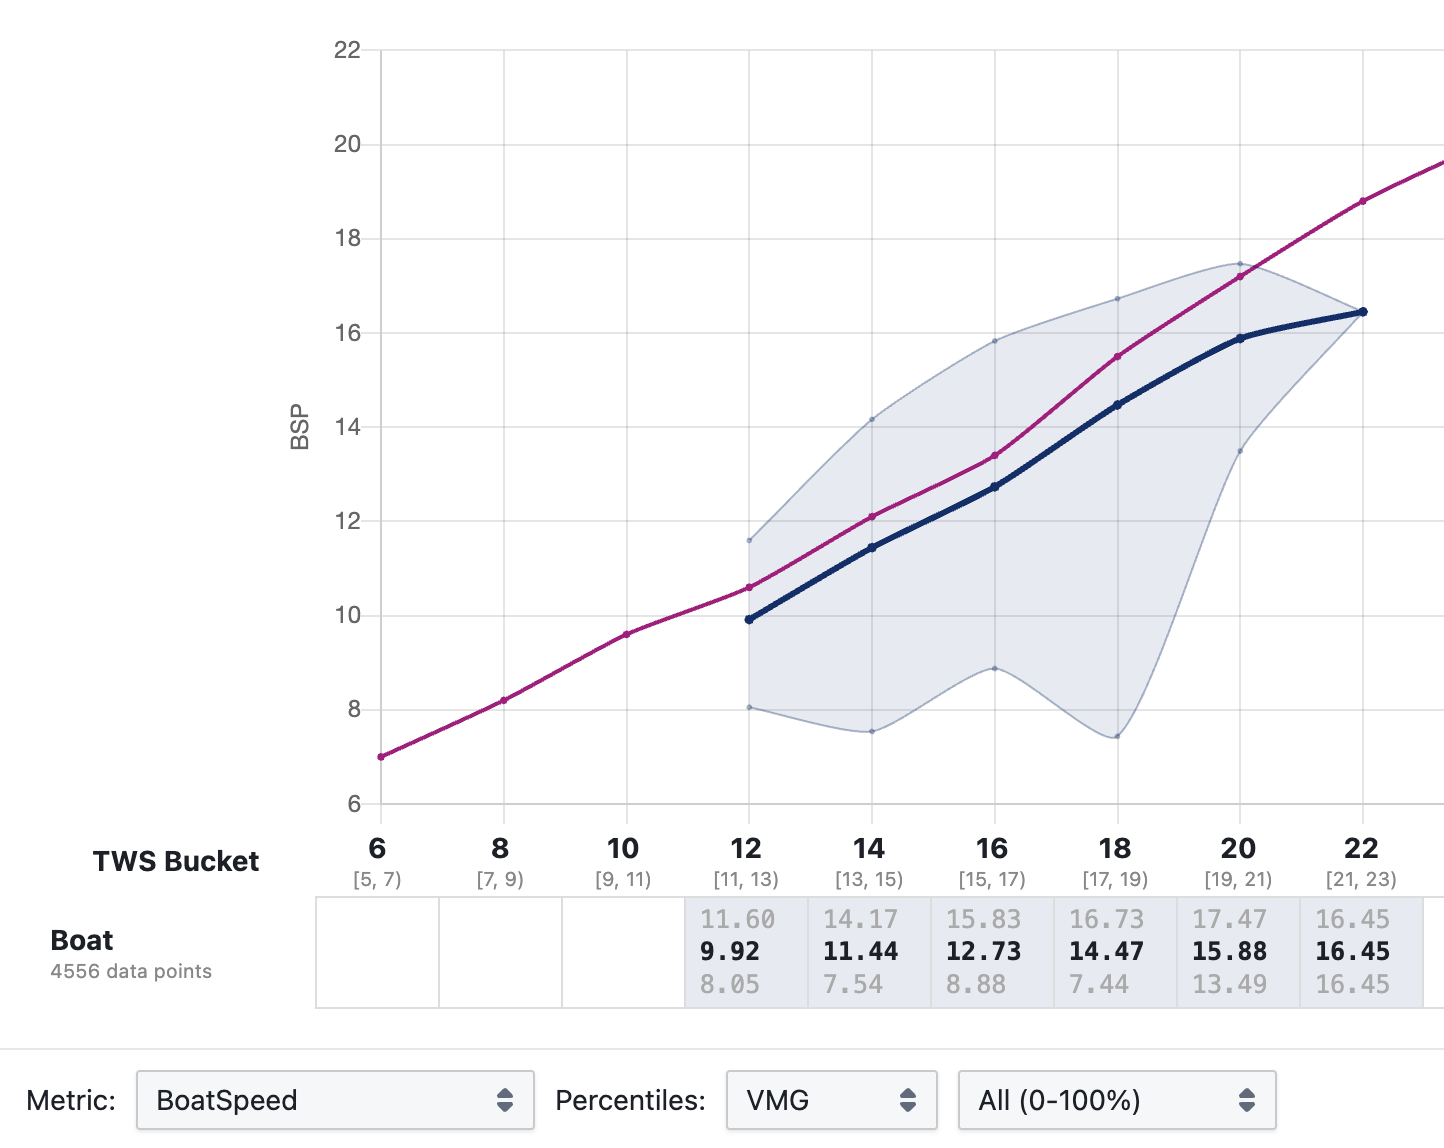
Compare your actual boatspeed and VMG against polar targets across wind speed ranges — the primary view for tracking performance trends over a race day or season.
Displays a selected metric (BoatSpeed by default) for upwind or downwind sailing, split into TWS buckets. The coloured band shows the min/max range across the dataset; a bold line shows the mean. When a polar is configured for the boat, target values appear as a separate reference line for direct comparison.
The bold line represents the average of that data, which may optionally be calculated only from a subset of data in each TWS bucket. For example, you could chose to average only the top 30% of data in each bucket by VMG, which would represent your "best data" and would be suitable to determine more "ambitious" targets for the selected performance metrics, compared to averaging all data in each TWS bucket (adjust the "Percentiles" setting).
Displays targets from configured polars for the selected boat as purple lines for comparison.
How data is processed
-
TWS bucketing — data points are grouped into TWS buckets with centre values at 6, 8, 10, … 30 knots. Bucket boundaries can be customised under Advanced Settings.
-
Ordering by Percentiles metric — within each bucket, data points are ranked by the Percentiles metric (VMG by default, since targets are optimised for upwind/downwind speed).
-
Percentile filtering — only data points within a selected percentile range are retained. The default preset ("high") keeps the 75th–95th percentile. The lower cutoff discards clearly poor sailing. The upper cutoff excludes momentary VMG spikes that are unlikely to be repeatable — this matters less when working with pre-aggregated data such as the Performance Database, so including up to the 100th percentile is perfectly reasonable there. A wider band (e.g. 75–95 rather than 90–95) retains more data points and produces a more stable average, which matters most for smaller datasets. The range also sets target aggressiveness: repeating 95th-percentile VMG is much more demanding than repeating 75th-percentile VMG, so the right choice depends on whether your team treats targets as aspirational numbers or as values that can be hit reliably.
-
Metric averaging — from the retained data points, the selected display metric (BoatSpeed, TWA_Abs, Heel, etc.) is averaged using an unweighted mean. This is the value shown as the bold line in the chart and in the table. The table also shows min/max values computed from the full dataset before percentile filtering.
-
Combined series — when multiple data series are shown simultaneously (e.g. in Performance Database mode), they are combined into a weighted average where larger series contribute proportionally more. This appears as the "Combined" series in black.
Configuration: what to change and why
Percentiles metric vs. display Metric
Step 3 (which data points are selected) and step 4 (which value is read from those points) are independent controls. The Percentiles metric determines the selection criterion; the display Metric determines what is averaged over the selected points.
For cockpit targets the correct setup is Percentiles: VMG with whatever Metric you need to read off. This selects the moments of highest upwind/downwind speed, then averages the chosen metric across those moments. To build a full targets table, keep Percentiles: VMG fixed and cycle through Metric: BoatSpeed, Metric: TWA_Abs, Metric: Heel, and so on. Each pass uses the same set of selected data points — only what is read from them changes.
Percentile range
The lower bound of the range (e.g. 75th) controls how much poor-performance data is discarded. Raising it reduces noise from bad tacks, lulls, or distracted sailing, but also reduces the number of data points available for averaging. The upper bound (e.g. 95th) controls how much of the very top is kept. Excluding the absolute top few percent removes momentary spikes that are unlikely to be repeatable in normal sailing — relevant for raw session data, less so for the Performance Database where data is already aggregated. Including up to the 100th percentile is reasonable when the underlying data is clean.
The range also determines target aggressiveness. A band centred around the 90th percentile produces numbers the team can hit on a good day; one centred around the 50th–75th produces numbers achievable more routinely. The right choice depends on how the team uses targets — as a stretch goal or as a reliable baseline.
This also explains why the chart numbers change when you change the Percentiles metric: you are changing step 3, which changes the subset of data points that reaches step 4, which changes every average regardless of which Metric is displayed.
Polar Diagram

Available In Only Races, Aggregate all Dates in Event, individual races/trainings, Performance Database, Entire Day
Requires True wind angle and speed (TWA/TWS) data
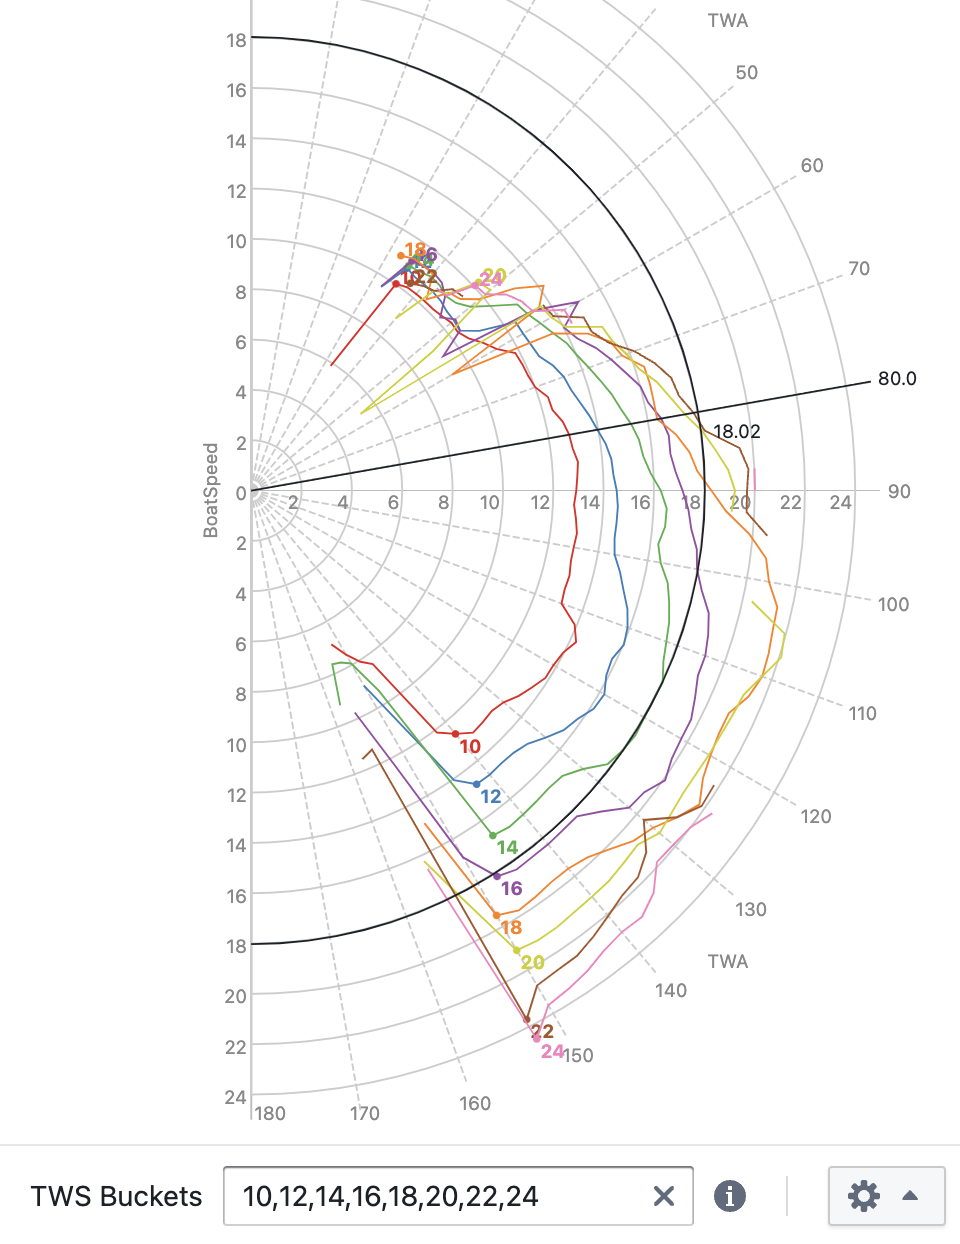
See your actual performance against targets across all wind angles and speeds in the classic radial polar format. Each TWS bucket is drawn as a curve; polar targets overlay directly for comparison. Use this view to identify where your boat is fast and where speed is being left on the table.
Each point in the diagram represents measured BoatSpeed at a given TWA, grouped into TWS buckets.
Two labeled points on each TWS line represent the upwind/downwind angles with best VMG (target boat speed).
Consider limiting the visualization to only a small handful of TWS buckets, especially when comparing different performance database entries, or when comparing port to starboard data (enable Color by Tack in the settings menu), to keep the diagram readable.
Consider increasing the Smoothing setting if you have limited data and lines appear jagged. However, for best results, the more data you can collect the better.
Use the Speed Metric configuration menu to select either BoatSpeed or SOG as the speed metric.
Use the zoom buttons or your mouse wheel to zoom into crowded areas.
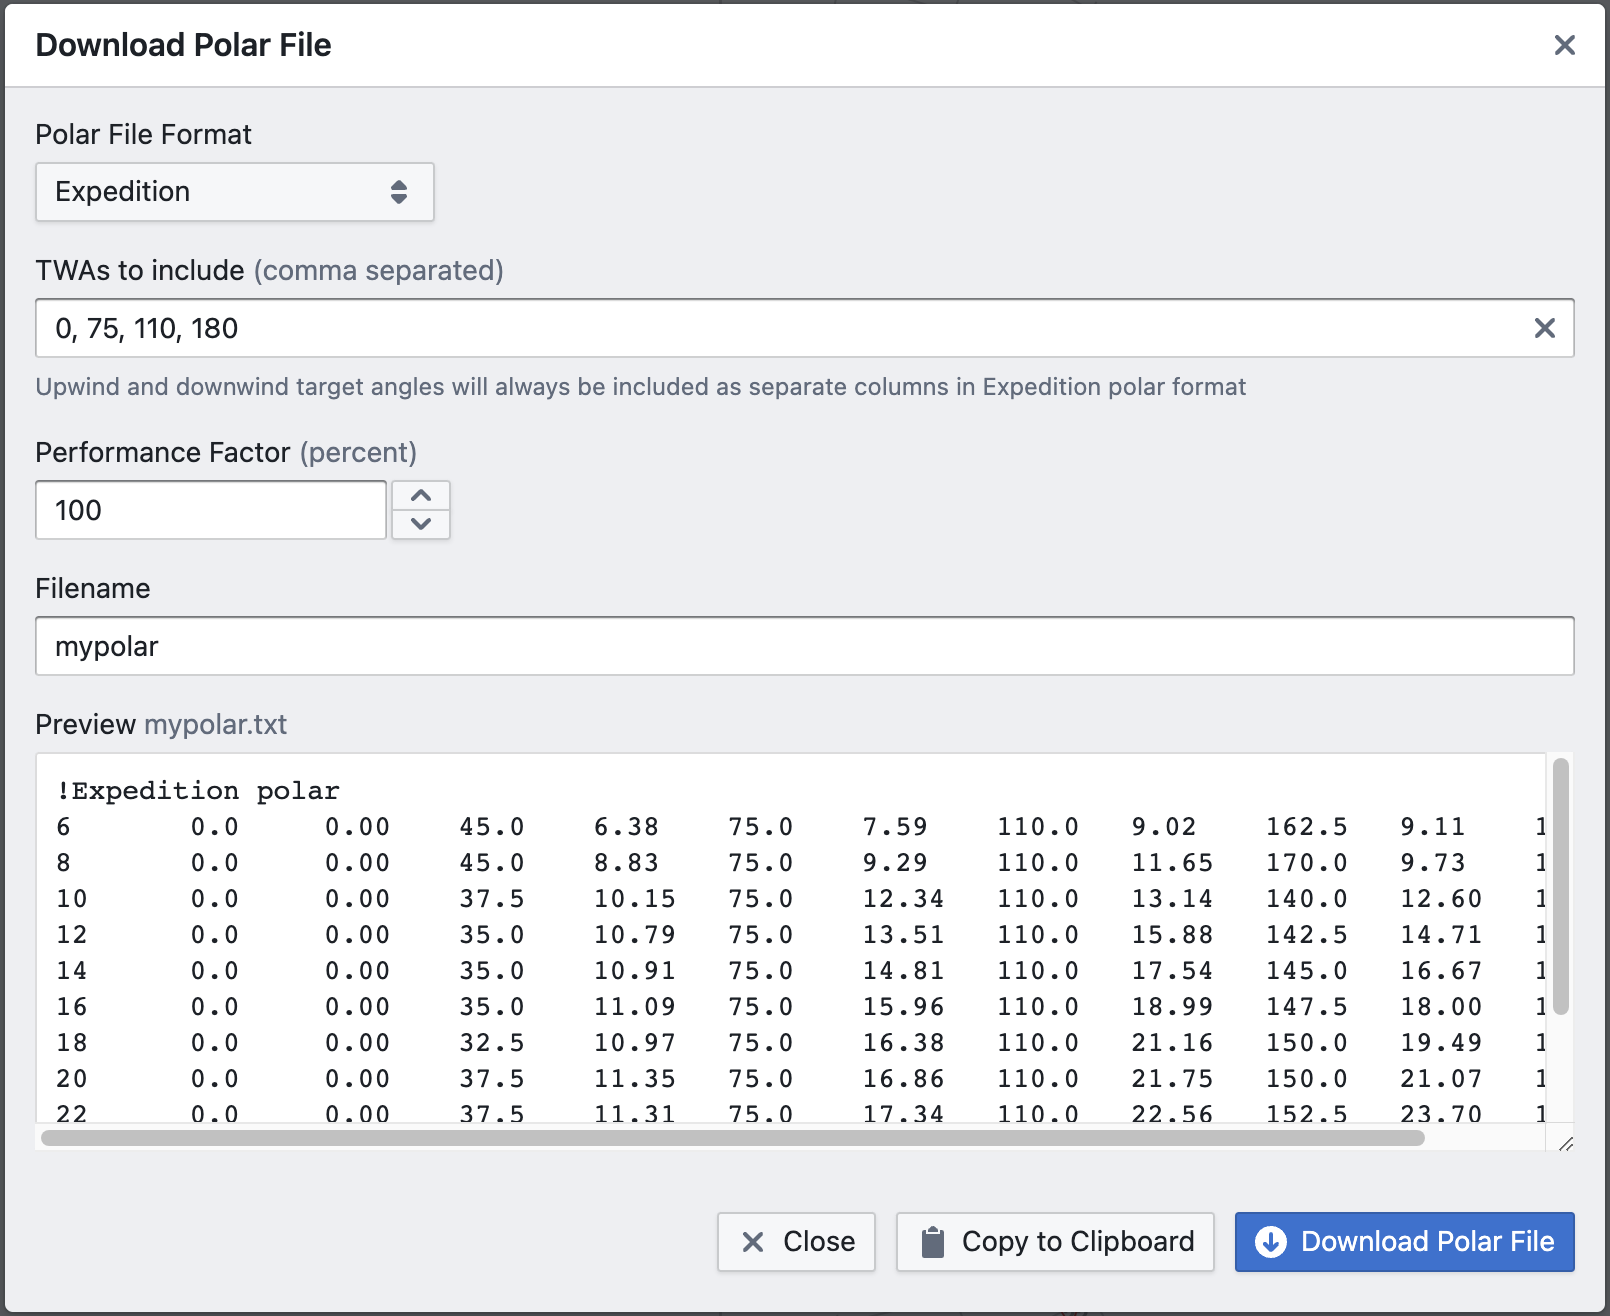
Use the Download button to download the polar data in one of the supported polar file formats:
- Expedition
- B&G
- Deckman
- Adrena
- ORC
- SailGrib
How data is processed
-
TWS and TWA bucketing — data points are grouped by TWS bucket (configurable centre values) and by TWA bucket according to the configured granularity (e.g. 5° increments). Smaller TWA increments produce finer resolution but require a larger, cleaner dataset to populate each bucket reliably.
-
Ordering by performance metric — within each TWS × TWA bucket, data points are ranked by the selected speed metric (BoatSpeed by default).
-
Quantile selection — the representative value for each bucket is the configured quantile (default: 90th percentile). This filters out the lowest-performing moments while retaining a stable, data-driven estimate of achievable speed at that wind condition.
-
TWS lines — all buckets sharing the same TWS value are connected to form a single curve, plotted radially from 0° to 180° TWA.
-
Polar diagram — the curves for all TWS values together form the complete polar diagram.
Configuration: what to change and why
TWA granularity
Smaller TWA bucket increments (e.g. 2° instead of 5°) produce a higher-resolution curve but spread the same data across more buckets, so each bucket contains fewer points. With limited data this makes individual bucket estimates noisy and the curve jagged — the Smoothing setting compensates for this, but finer granularity only helps if the dataset is large and clean enough to support it.
Quantile
The quantile (step 3) controls which level of performance is treated as representative for each TWS × TWA bucket. The default 90th percentile discards the bottom 90% of moments in each bucket, keeping only the fastest. Raising it (e.g. to 95th) produces a more aspirational polar by selecting only the very best moments; lowering it (e.g. to 75th) produces a more conservative one that reflects typical good performance rather than peak performance. Unlike the Targets view, there is no separate selection metric here — the same metric (BoatSpeed or SOG) is used for both ordering and display.
TWS bucket boundaries
The default bucket centres (6, 8, 10, … 30 knots) are evenly spaced. If your sailing data is concentrated in a narrower wind range, custom bucket boundaries let you increase resolution where the data is dense and avoid near-empty buckets at the extremes.
Bin Table

Available In Only Races, Aggregate all Dates in Event, individual races/trainings, Performance Database, Entire Day
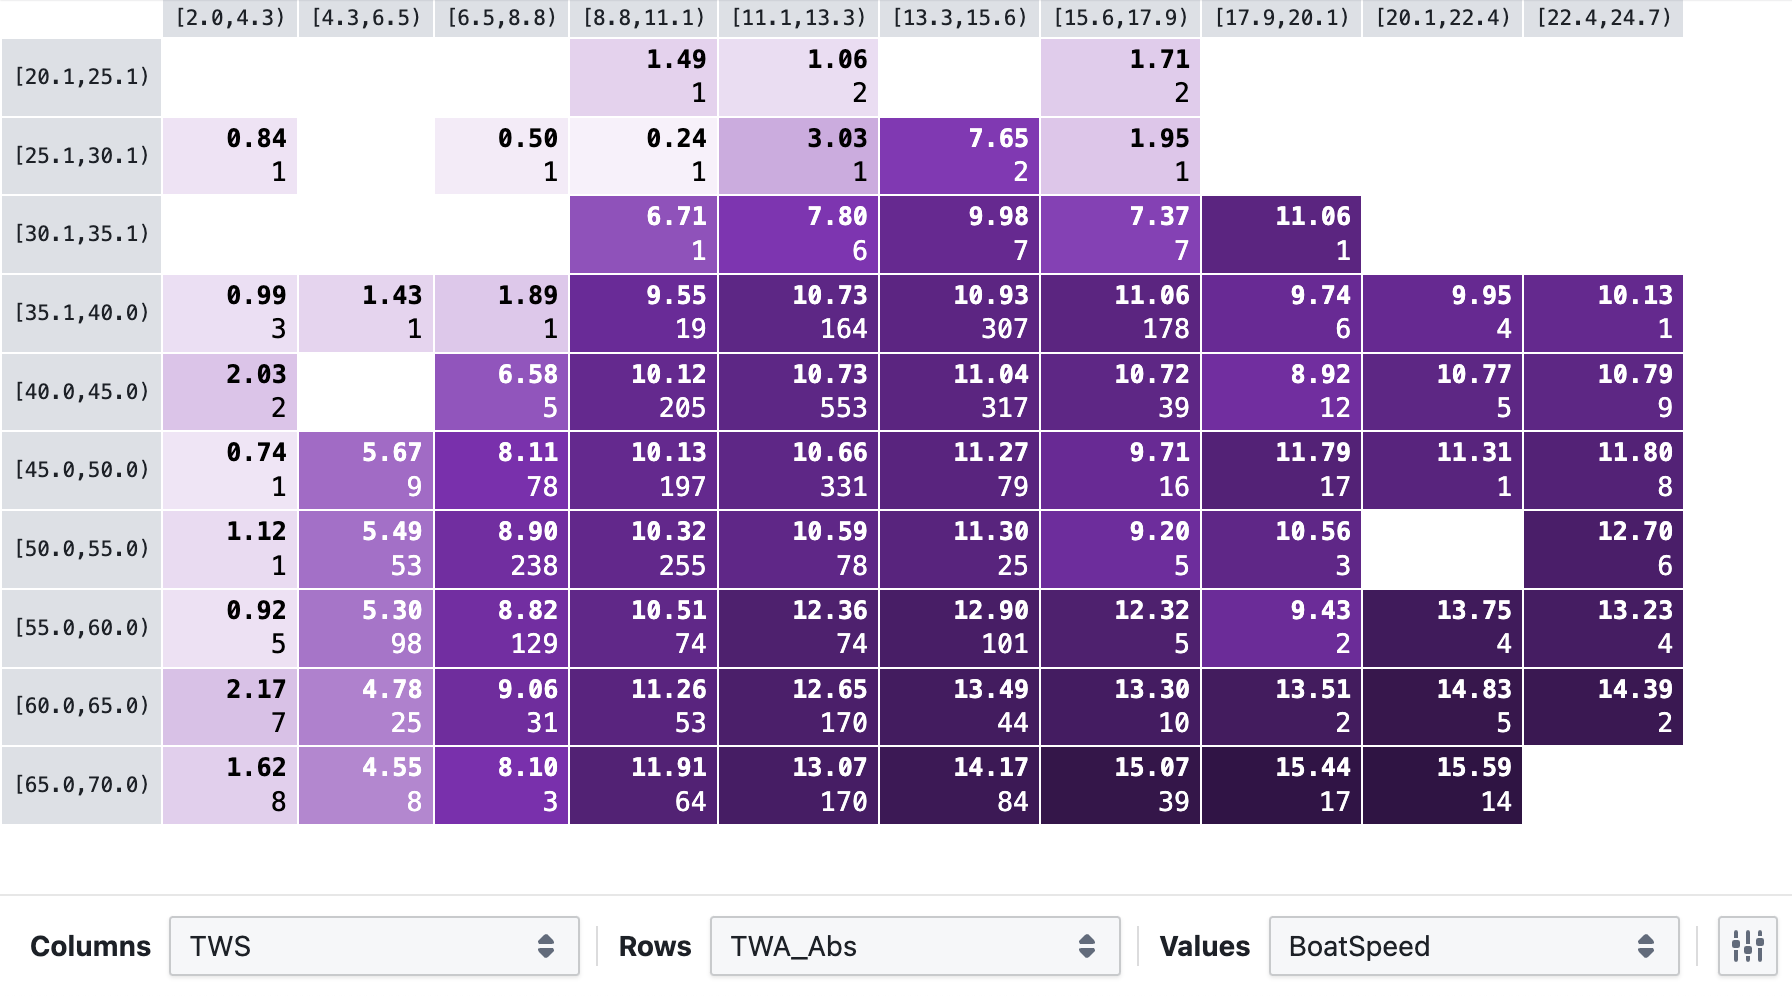
Groups data into bins (buckets) along two configurable metrics. In each bin, a configurable aggregation is displayed (in this example, the average/mean, and count of values).
You can let a certain number of bins be automatically determined by from the range of data, or enter custom bin boundaries.
Correlation

Available In Only Races, Aggregate all Dates in Event, individual races/trainings, Performance Database, Entire Day
Explore how various metrics correlate and discover different ways to achieve your best performance in different conditions.
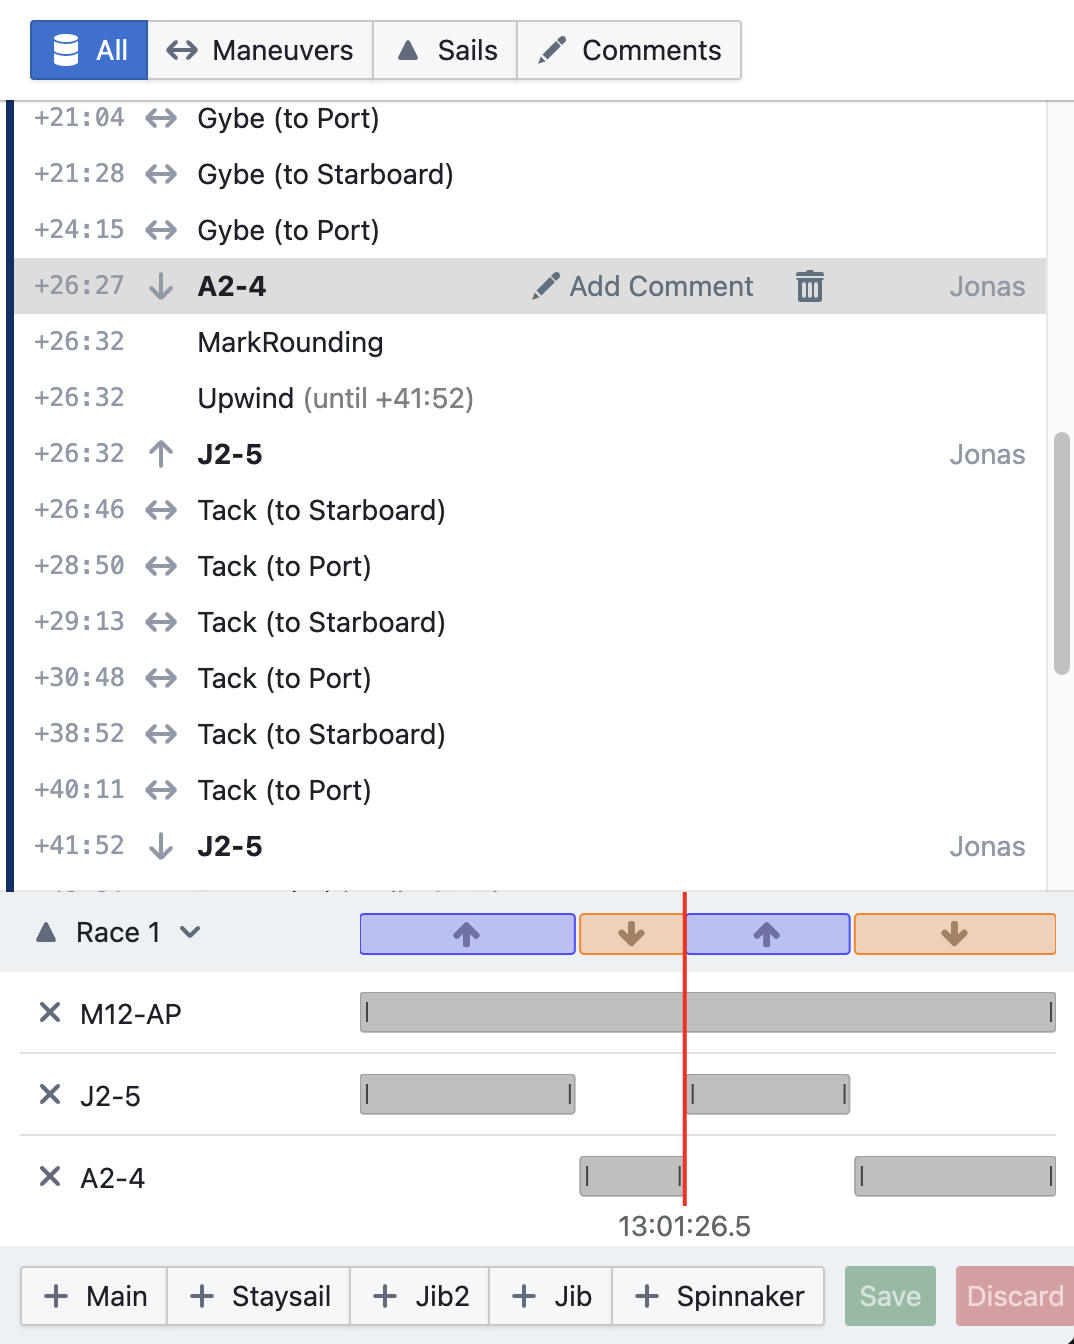
Sails / Comments

Available In Entire Day, individual races/trainings
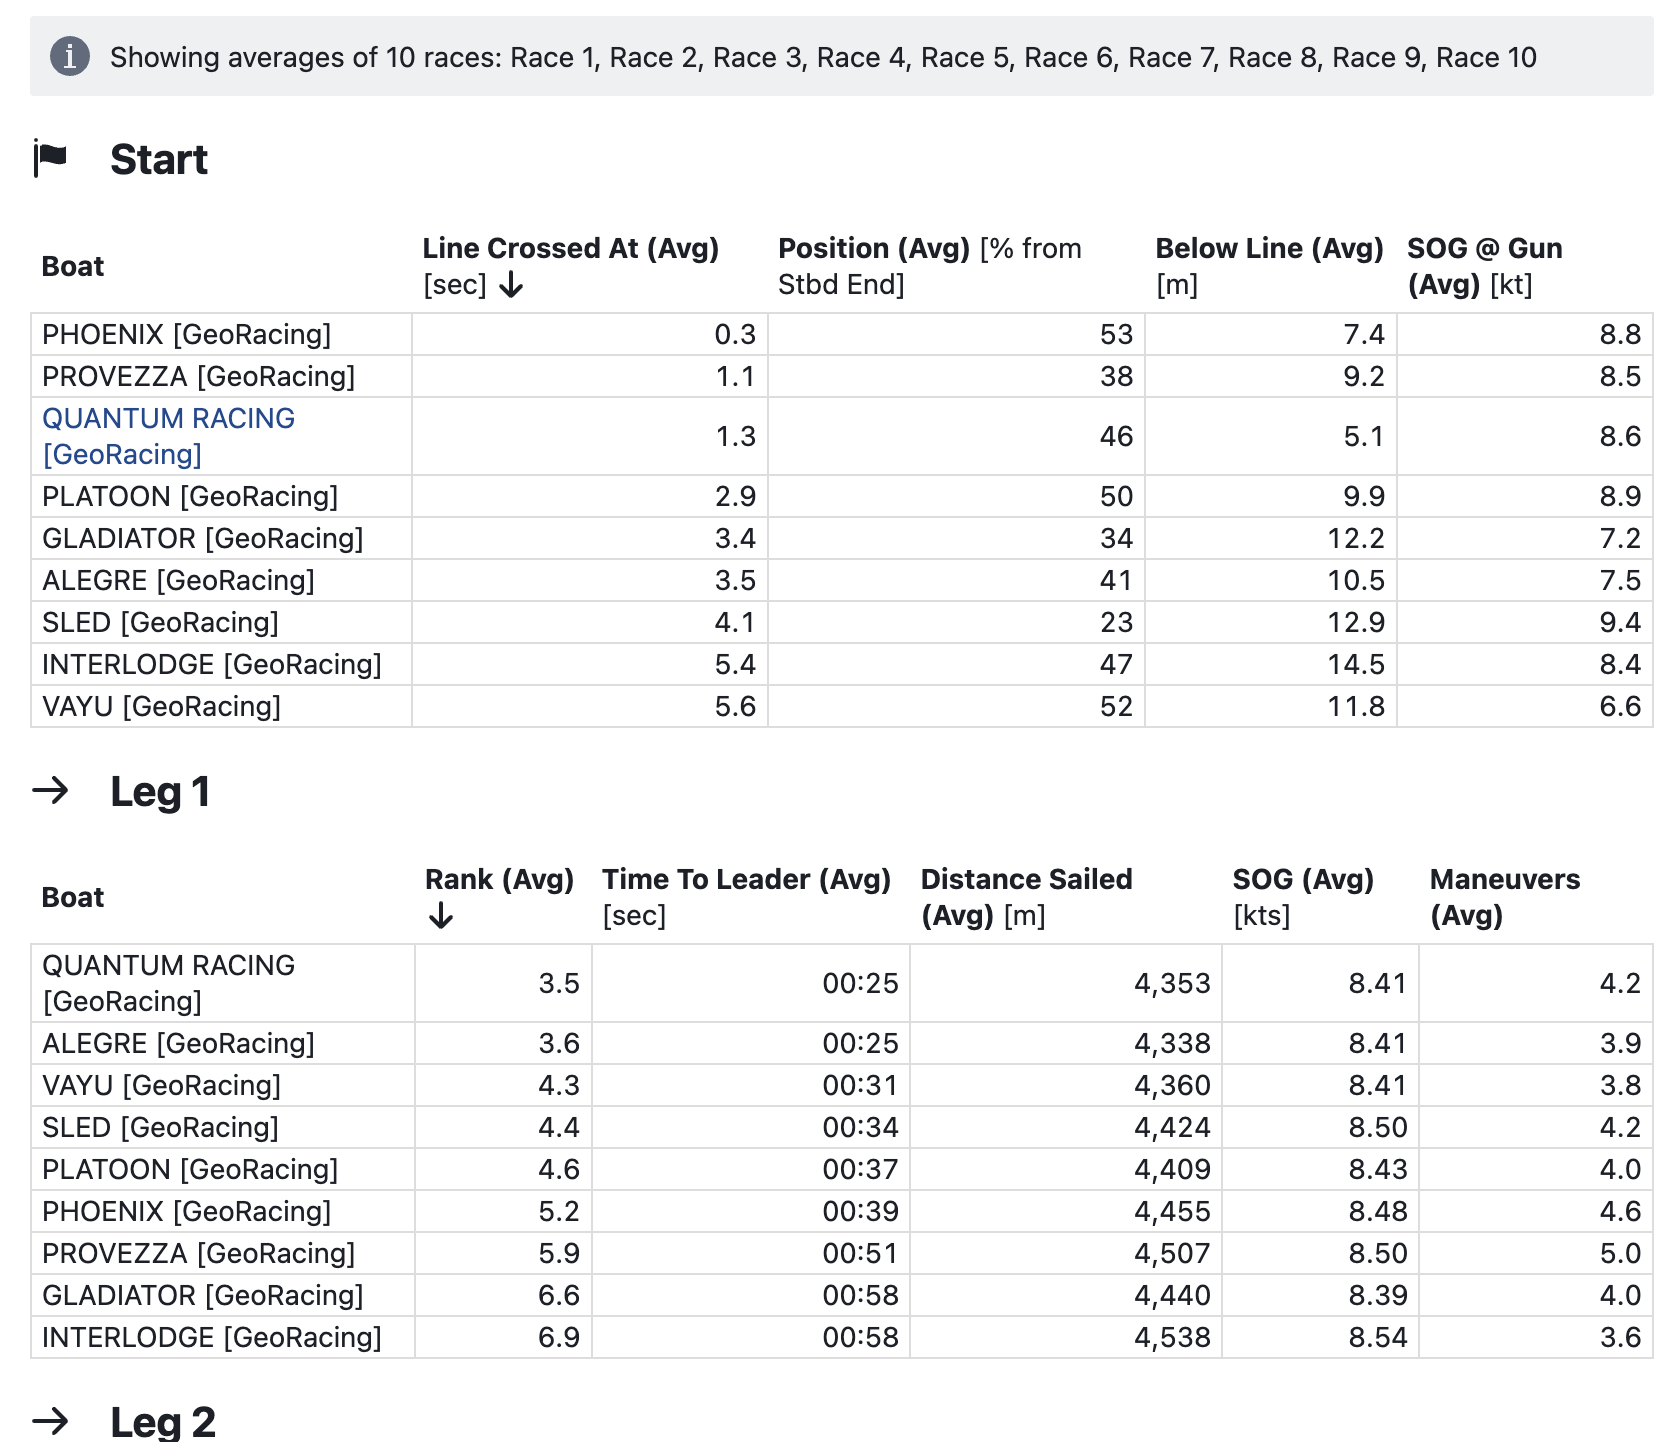
Fleet Race

Available In Only Races, Aggregate all Dates in Event
Requires Races with complete race course (start line, marks, finish line)
See how the whole fleet moved — mark by mark, leg by leg. Use this view to understand not just where you finished, but where positions were gained and lost relative to the boats around you.
Displays average mark ranks, start line positions, and distance sailed or time taken per boat per leg.
A variant of this view is also available for each race individually, in a Fleet Race Report.
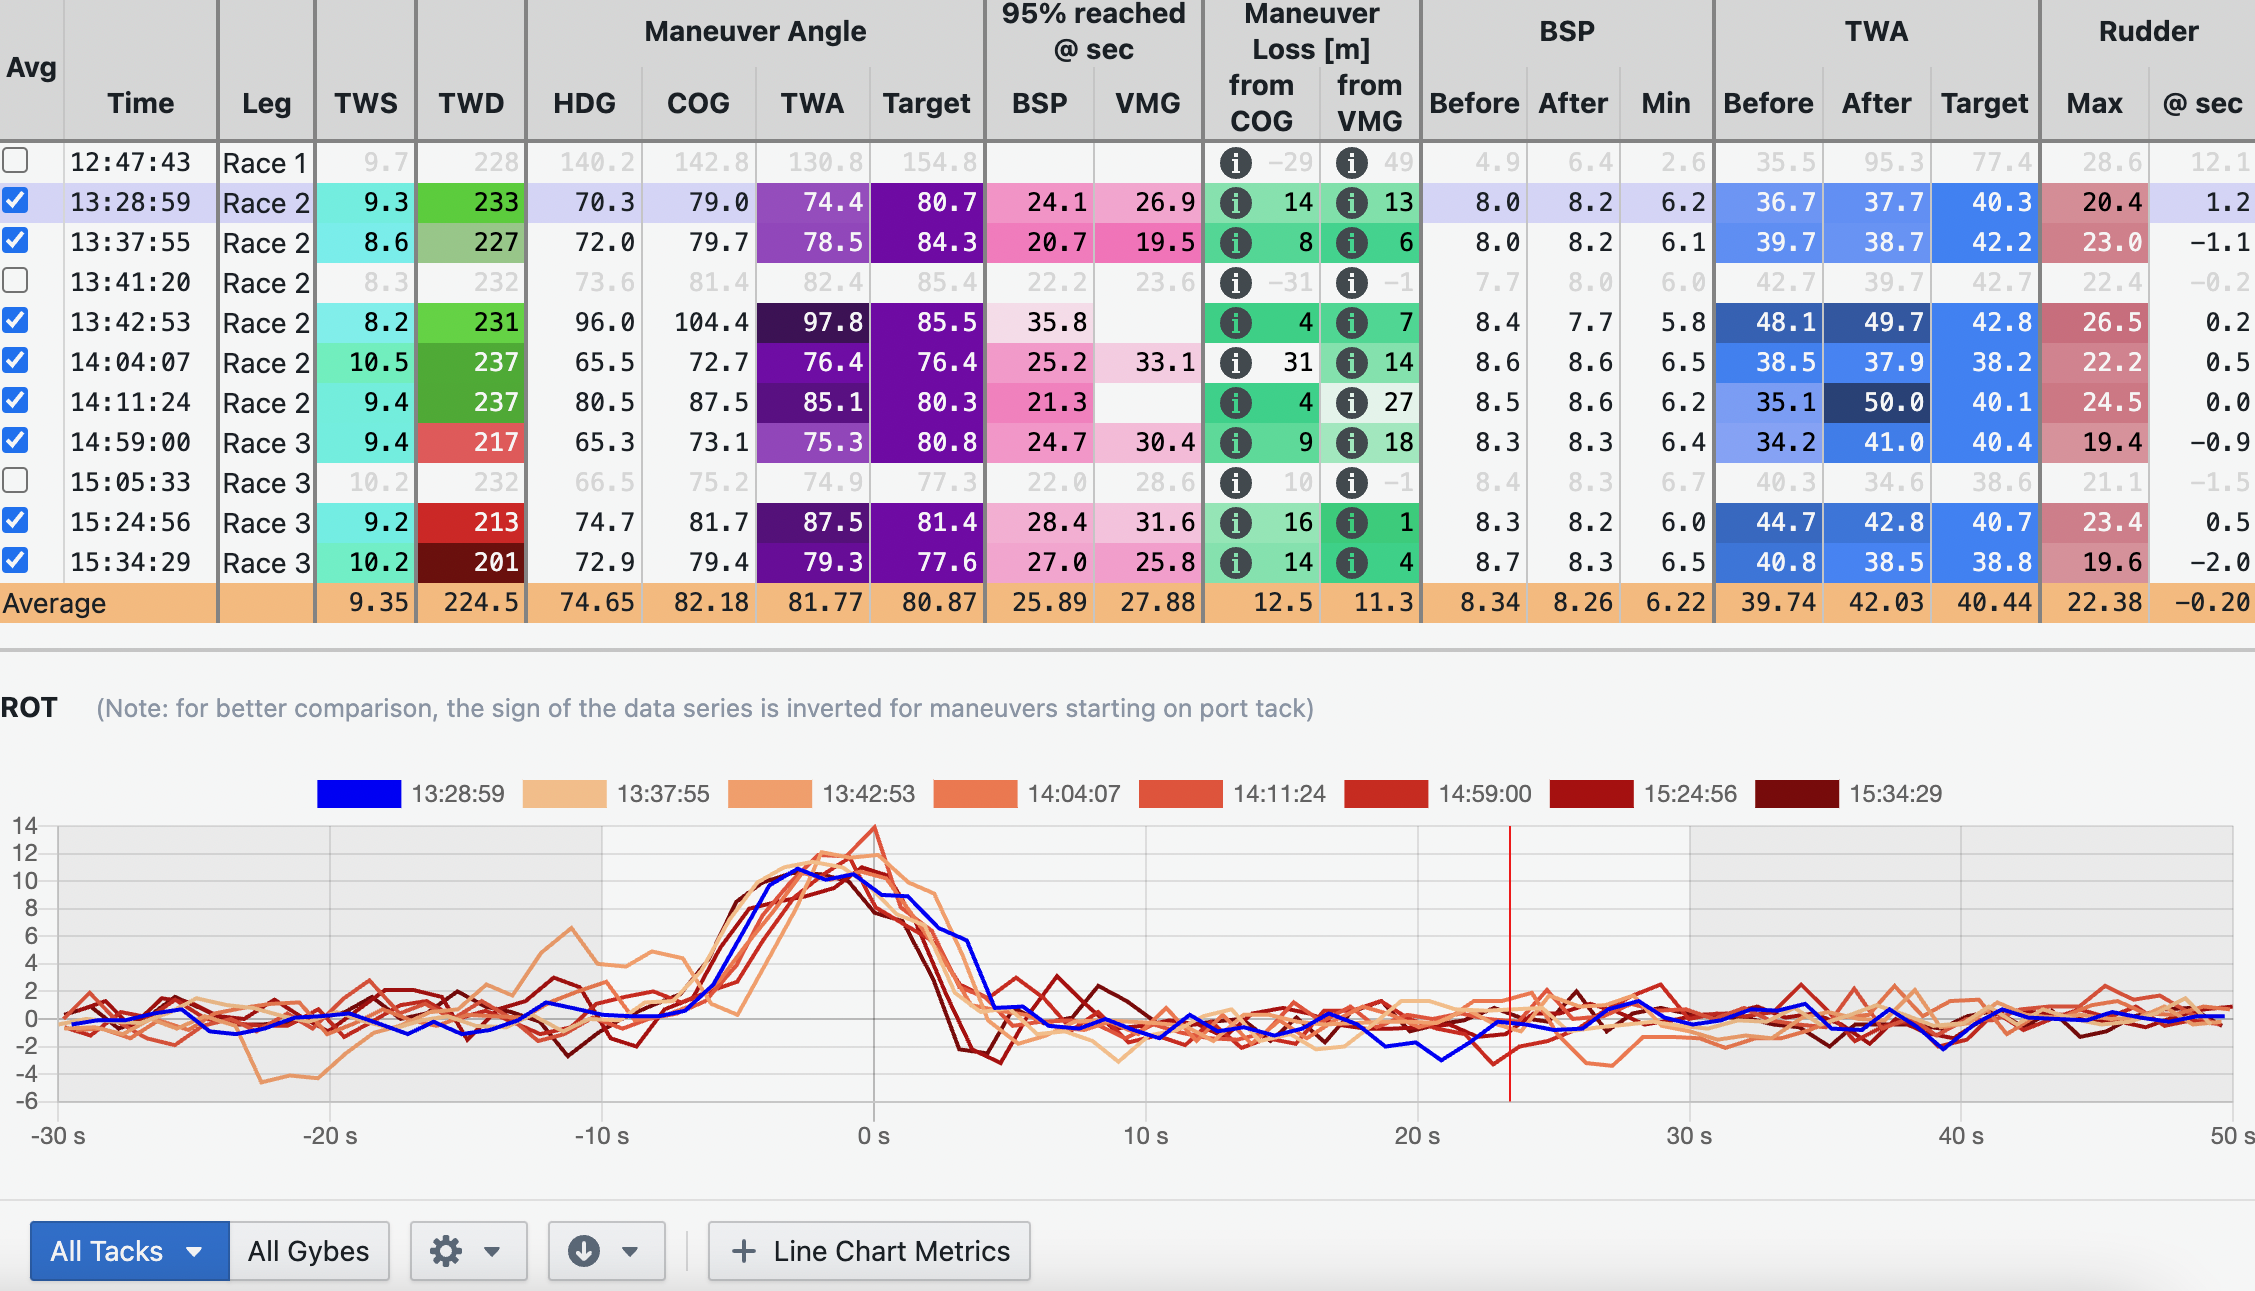
Maneuvers

Available In Only Races, Aggregate all Dates in Event, individual races/trainings, Entire Day
Every tack and gybe from the selected period, aligned on a common timeline and ranked by loss — so you can immediately see which maneuvers were clean and which cost distance.
Displays a table of maneuvers of the selected type (tacks, gybes, turn ups, bear aways). The line chart(s) below show selected metrics superimposed and aligned around the time of each maneuver (head to wind or TWA = 0, unless configured otherwise). Click any maneuver to highlight it in the charts and table.
To learn more about the requirements to have maneuvers detected and analyzed, see Maneuver Analysis.
Calibration

Available In Only Races, Aggregate all Dates in Event, individual races/trainings, Entire Day, Performance Database
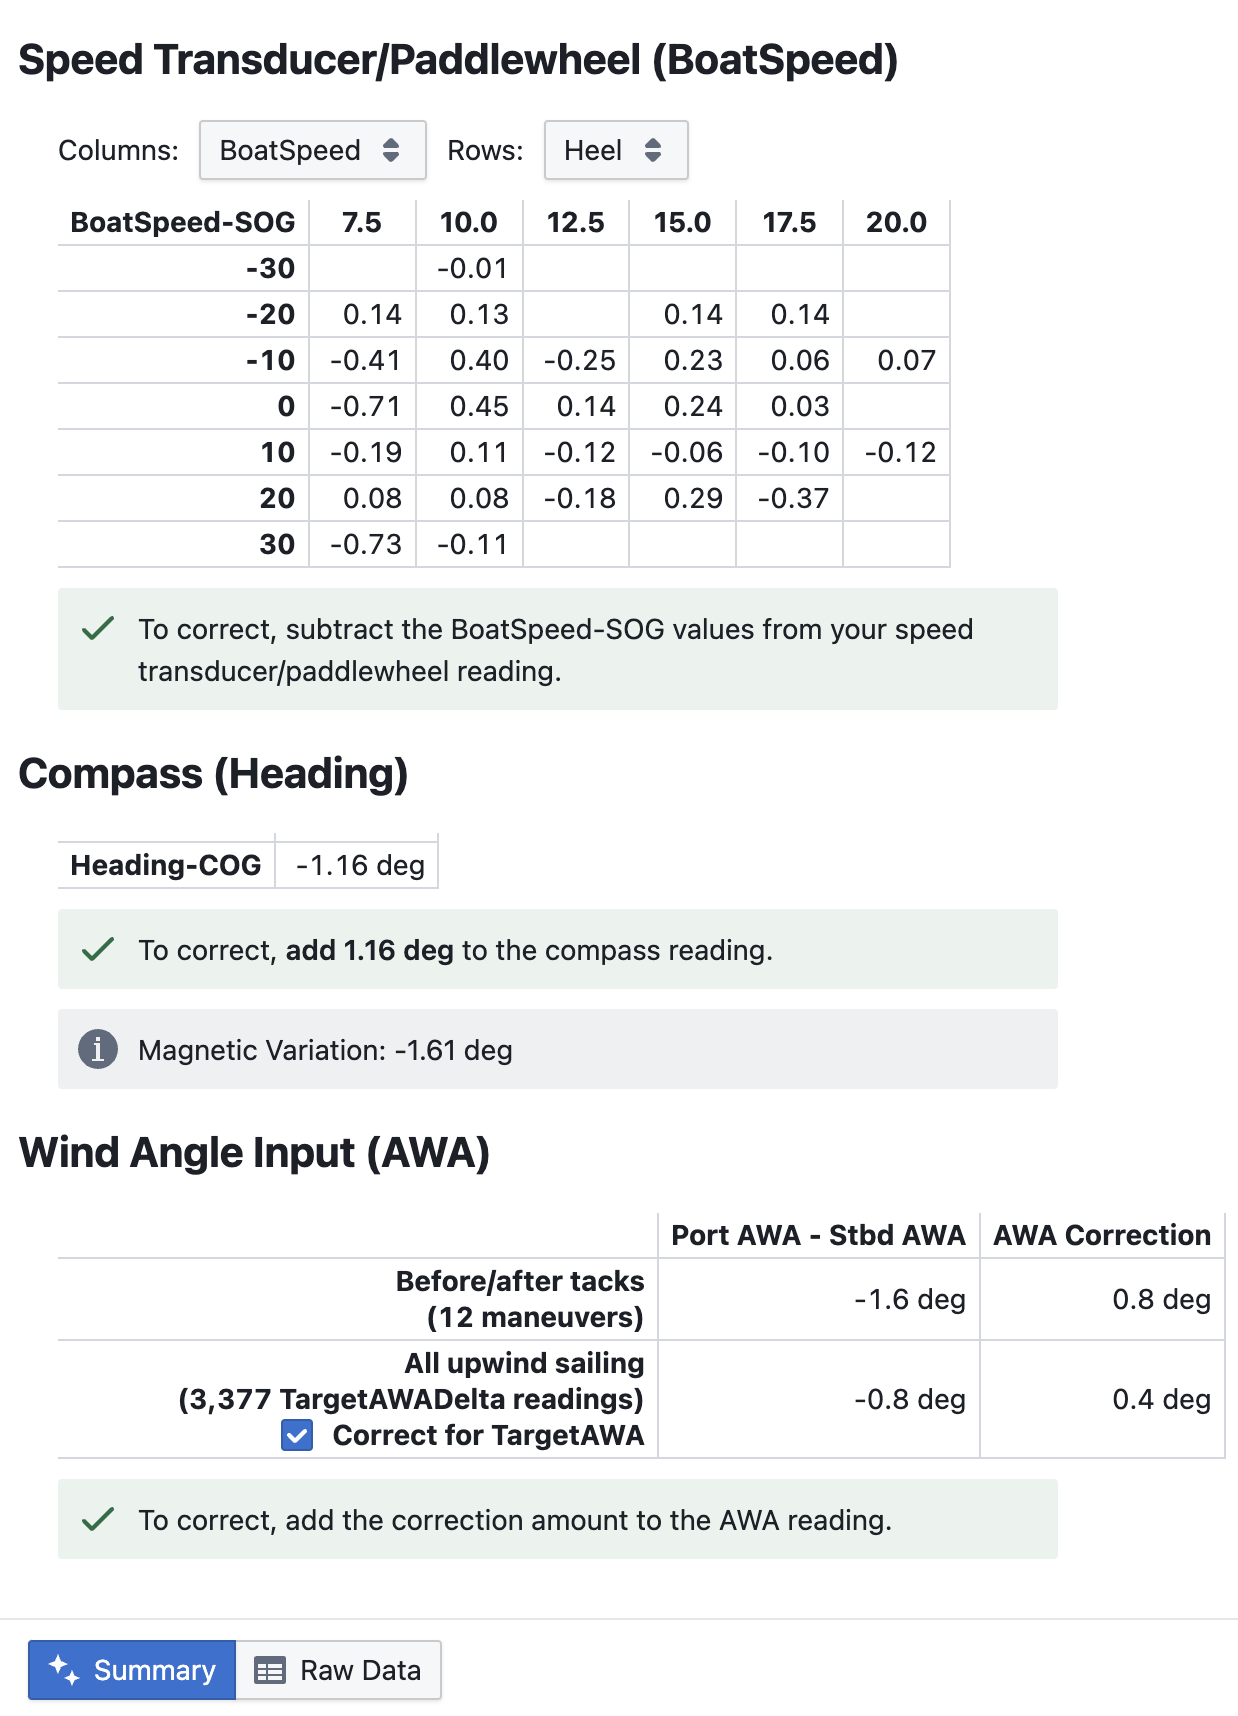
Displays statistics to help with the calibration of the following instruments:
Speed Transducer/Paddlewheel calibration is based on the BoatSpeed - SOG difference. For best results, select a segment of data with as little current as possible or sail an equal amount in opposite directions.
Compass calibration is based on the Heading - COG difference. For best results, select a segment of data with as little current as possible or sail straight into the current or with it. Make sure your compass is mounted in a fixed position.
Wind Angle Input calibration is based on the Port AWA - Stbd AWA difference. Two different calculations are offered, choose whichever seems most suitable to you. The "Before/after tacks" line is comparing AWA before and after each tack; it assumes the boat is sailed at TargetAWA angles before and after the tack and that TWS is similar before and after a tack (i.e. TargetAWA is the same before and after a tack). The "All upwind sailing" line is comparing AWA readings from all upwind sailing in the selected segment (excluding maneuvers). When TargetAWA or TargetTWA data is available, you have the option to correct for TargetAWA, which means the TargetAWADelta is compared on port and starbord tack instead of comparing AWA directly. This results in a more accurate calculation, and accounts for different wind speeds across the selected data segments; esp. when average windspeeds are different on port and starbord tack throughout the measured segment.
A "Raw Data" option is also available which is similar to the calibration report, and offers raw data for more detailed (manual) analysis.
Sail Crossover

Available In Only Races, Aggregate all Dates in Event, individual races/trainings, Entire Day, Performance Database
Visualizes the true wind angles and speeds at which you have sailed the boat's sails (actual sailing data - as opposed to a sail designer crossover chart). TWA/TWS data is grouped into buckets, the size of which you can configure from fine to coarser. When more than one sail was used in a TWA/TWS bucket, the sail with highest boatspeed is shown (using 80th percentile boat speed in that bucket). Hover over the chart to see a tooltip with more information for each bucket.
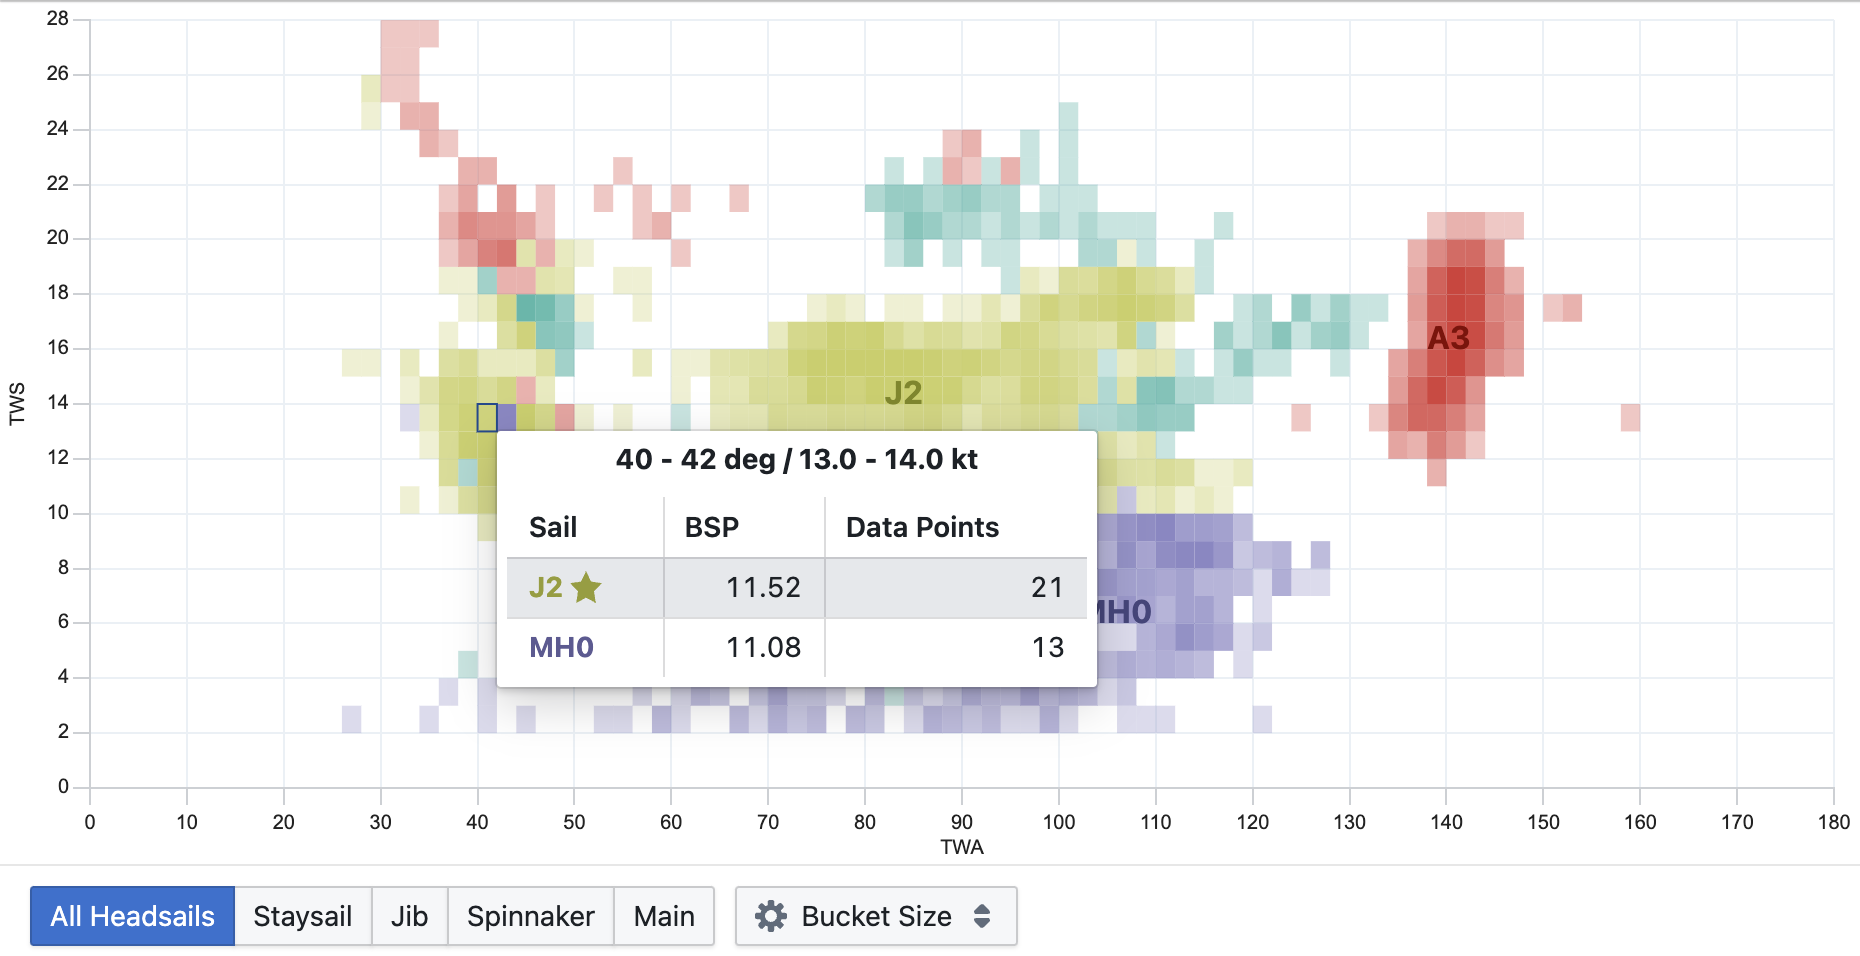
Use the Download button to download the crossover chart in Expedition format.
Data Explainer

Available In individual races/trainings, Entire Day
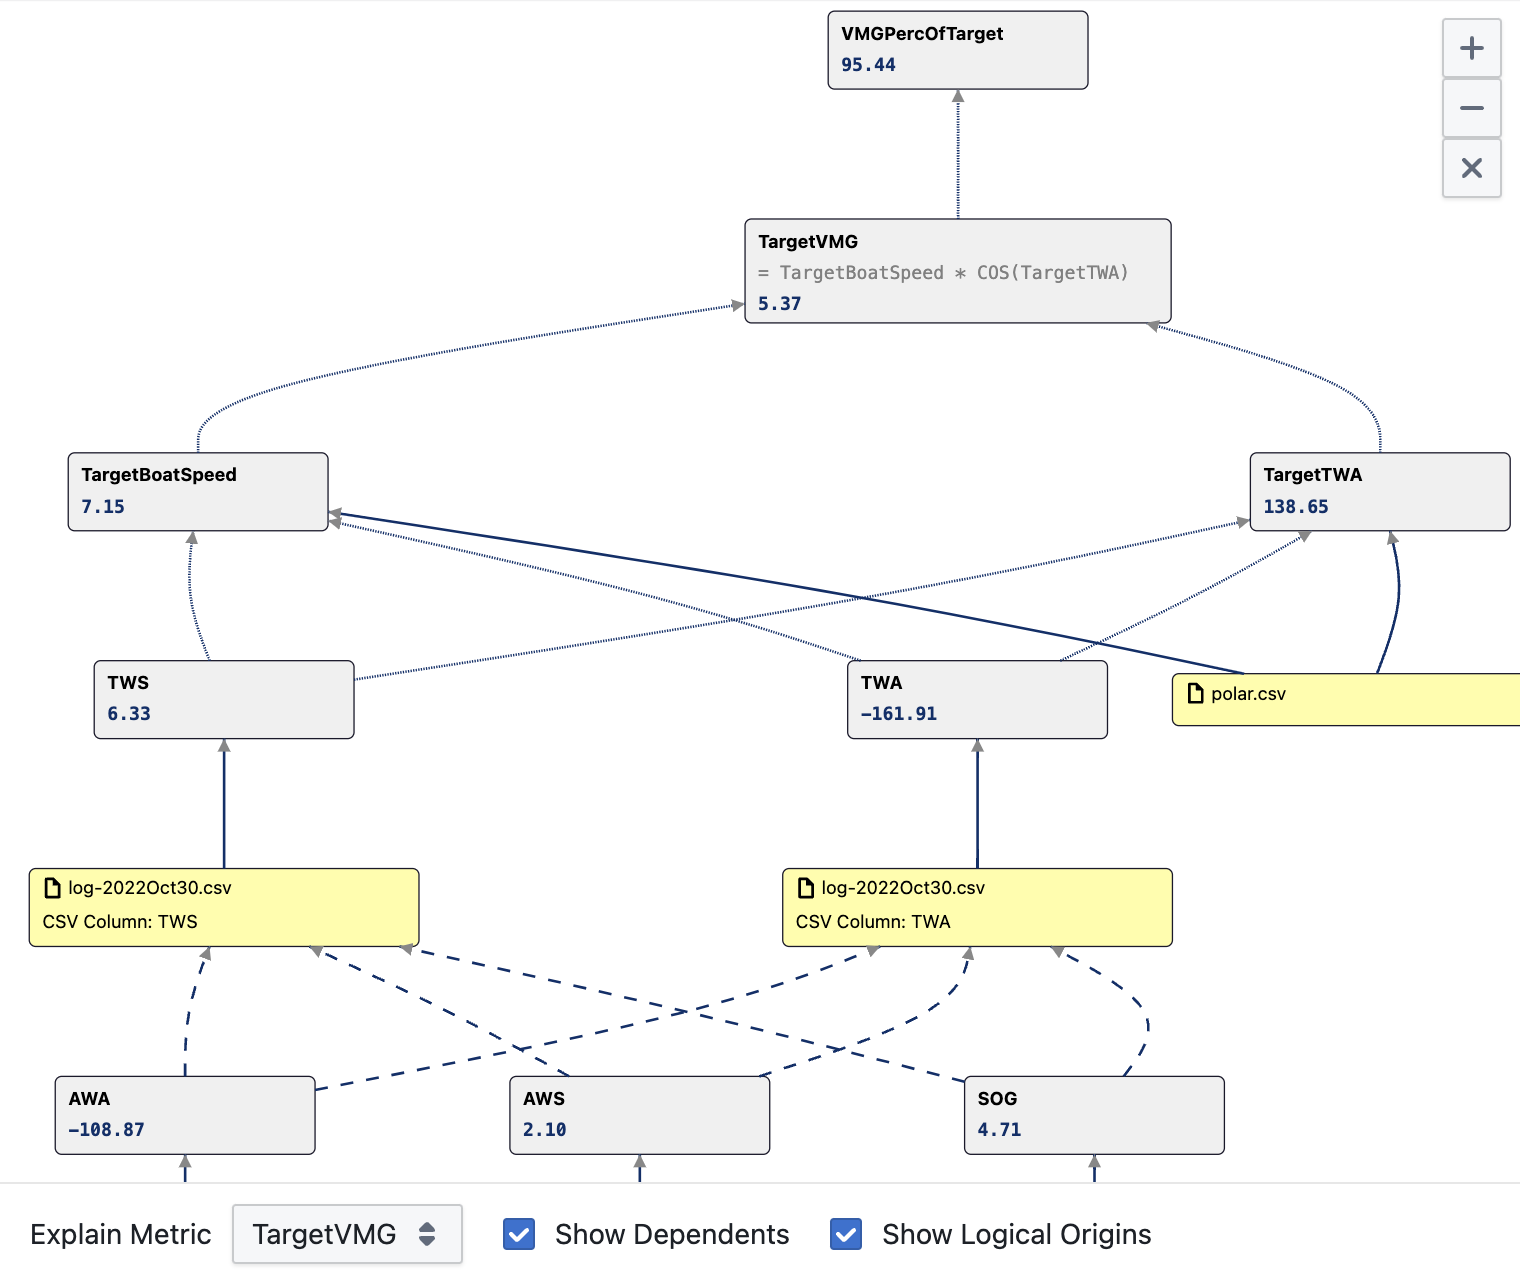
Displays the dependency hierarchy for a selected metric and, using metric values at a highlighted time, explains how a value is calculated or where (in which file/column) it originates. For example, if your VMG value seems off, you can understand how it is calculated and see the BoatSpeed and TWA values to figure out which one of these is inaccurate.
Metric values in each node are shown either for the highlighted time (opposite view) or for the first highlighted range (average values). Selecting more than one boat is supported for comparative analysis
Select Show Dependents to include metrics that depend on the selected metric (e.g. when selecting VMG, this might show VMGPercOfTarget above the VMG node).
Select Show Logical Origins to include related nodes for values that originate in a file (connected using dashed lines). E.g., even when VMG originates in your log file, this will still show BoatSpeed and TWA nodes as those influence the VMG value, even when the calculation did not happen in Njord.
Works best with recent uploads (December 2023 or later). Older uploads may show limited information.
Maneuvers
Find your best maneuver. Understand your worst. Maneuver analysis takes every tack and gybe from the day, aligns them on a common timeline, and ranks them by loss — so you can see at a glance which maneuvers were clean and which cost you distance.
To analyse a maneuver, the criteria for both maneuver detection and maneuver analysis must be met as described below.
Maneuver Detection
When you upload or re-process uploaded data, maneuver detection is performed automatically. All detected maneuvers show up as annotations in the Table or Line Chart visualization types. If a maneuver doesn't show up where you expect it, see Troubleshooting Maneuver Detection below.
Requirements For a Maneuver to be Successfully Detected:
- The
TWA(true wind angle) metric must be present in your data, which can either be included in your log files directly from your instrument system, or it can be automatically calculated by Njord from either apparent wind and boat speed, or true wind direction and boat Heading/COG.
The following parameters are used in maneuver detection. They can be configured under the respective boat's Settings - Filters. After changing these settings, you need to re-upload data or re-process uploaded data (re-process by going to the Process tab in your uploaded data, add a Derived Metrics step, and Apply).
- Upwind TWA Range: the true wind angle range that would be considered upwind sailing for your boat (by default: 30 - 60 deg)
- Downwind TWA Range: the true wind angle range that would be considered downwind sailing for your boat (by default: 120 - 170 deg)
- Exclude Time Before Maneuvers: the maximum reasonable amount of time your boat requires from the first rudder inputs or trim changes in preparation for the maneuver, until the time of the maneuver
- Exclude Time After Maneuvers: the maximum reasonable amount of time your boat requires from the time of the maneuver until target wind angle and boat speed have been re-established
Maneuvers are automatically detected when the following conditions are met. The time of the maneuver is the exact time when TWA hits the respective number (0/180/90).
- Tack: any time where
TWAis 0, Time Before Maneuvers seconds earlierTWAlies in the Upwind TWA Range, and Time After Maneuvers laterTWAalso lies in the Upwind TWA Range - Gybe: any time where
TWAis 180, Time Before Maneuvers seconds earlierTWAlies in the Downwind TWA Range, and Time After Maneuvers laterTWAalso lies in the Downwind TWA Range - Turn Up: any time where
TWAis 90, Time Before Maneuvers seconds earlierTWAlies in the Downwind TWA Range, and Time After Maneuvers laterTWAlies in the Upwind TWA Range - Bear Away: any time where
TWAis 90, Time Before Maneuvers seconds earlierTWAlies in the Upwind TWA Range, and Time After Maneuvers laterTWAlies in the Downwind TWA Range
Troubleshooting Maneuver Detection
If a maneuver is not being detected as expected, check the following, starting at the time of the maneuver. Use the Table or Line Chart visualization types to inspect TWA data at and around the time of the maneuver.
- Verify TWA data availability. Confirm that TWA (true wind angle) data is present in your data at the time of the maneuver. If no TWA is available, add TWA for example by adding wind data.
- Verify TWA at the time of the maneuver. TWA must cross 0 / 180 / 90 degrees for tacks / gybes / turn ups and bear aways, respectively. If it doesn't do that, TWA data may suffer from miscalibration or other errors that need to be corrected.
- Verify TWA at Time Before Maneuvers before the maneuver time. It must fall in the Upwind TWA Range or Downwind TWA Range configured for the respective boat. If it doesn't, consider expanding the valid TWA range, or increasing Time Before Maneuvers.
- Verify TWA at Time After Maneuvers after the maneuver. It must fall in the Upwind TWA Range or Downwind TWA Range configured for the respective boat. If it doesn't, consider expanding the valid TWA range, or increasing Time After Maneuvers.
Maneuver Analysis
The Maneuvers Visualization Type will perform an analysis of all detected maneuvers (see above).
The following parameters are used in maneuver analysis:
- Exclude Time Before & After Maneuvers: see above
- Average Time Before & After Maneuvers: set to 20 seconds each. Contact us to have it changed for your boat.
Maneuver analysis starts at Average Time Before Maneuvers seconds + Exclude Time Before Maneuvers seconds before the maneuver time. Starting at this time, boat data is averaged for a period of Average Time Before Maneuvers seconds, to establish the "Before" baseline of the boat's course, speed, etc. which is used to perform the maneuver analysis (incl. maneuver loss calculation).
Maneuver analysis ends at Exclude Time After Maneuvers seconds + Average Time After Maneuvers seconds after the maneuver time. Starting at Exclude Time After Maneuvers seconds after the maneuver time, data is again averaged for Average Time After Maneuvers seconds to establish the "After" comparison.
The maneuver analysis table shows various relevant metrics as averaged before and after the maneuver, as well two different maneuver loss calculation approaches. Click the "i" symbol near the maneuver loss values to learn more about how those are calculated.
Troubleshooting Maneuver Analysis
If a maneuver is not being analyzed, check the following conditions:
- If a maneuver hasn't been detected, it cannot be analyzed. Verify that the maneuver you've looking for has been detected (see above).
- Not all detected maneuvers can be fully analyzed. To learn why a detected maneuver has not been fully analyzed, select the options Include maneuvers without full analysis and Extended data from the Maneuvers Visualization Type configuration menu. The Reason Not Analyzed column will show why a detected maneuver has not been analyzed.
Aggregate Analysis
As a first step in your analysis, you have probably selected a race or training on a given date, and used any of the available visualization types to analyze data. This is great, but what if you want to analyze data across multiple races, an entire day, or across multiple days or events? There are options for that, too:
Races on a Single Day
In Events mode, expand the Only Races item in the sidebar (it may also be called Only Races & Trainings or Only Trainings). Select from one of the following options:
- Only Races: aggregates data from all races on that day
- Only Trainings: aggregates data from all trainings on that day
- Only Races & Trainings: aggregates data from all races and trainings on that day (this is different from the Entire Day option as it excludes all data that is not covered by one of the Trainings or Races on that day)
Further refine the selection with the Filter button, which allows analysing only Upwind or Downwind sailing, or only Port or Starboard tack within selected races and/or trainings.
Races on Multiple Days in a Single Event
Also in the Only Races / Only Trainings / Only Races & Trainings submenu, you will find a link Aggregate all Dates in Event…
Select or deselect races and trainings as needed to include or exclude them from the analysis. Quick selection options None, All, Races and Starts are available.
Further refine the selection with the Entire Races… button, which allows analysing only Upwind or Downwind legs of each selected race and/or training.
Races on Multiple Days across Events
Ad-hoc analysis of any boat's data across events is also possible. Go to https://app.sailnjord.com/events/multi, select a boat, optionally limit time range to only show events in that time range, and select races spanning multiple events to include in the analysis. You can only select races here, no trainings.
Note that when selecting a larger number of races, performance of some visualization types may be degraded due to the total amount of data included in the analysis. Prefer the Performance Database approach (see next section) which pre-aggregates data and works for larger sets of data.
Performance Database
For a permanent database of past performance that scales to full seasons, use the Performance Database. Select one or more phase collections for analysis — many visualization types will break out each collection as a separate dataset for comparison.
Further refine the selection with the Filter button, filtering by point of sail, tack, or hoisted sails (depending on the selected visualization type).
Sharing Boat Access in Njord Analytics
Explains how to give other people — teammates, coaches, or another team you're sharing data with — access to a boat in Njord Analytics.
Tip: The same mechanism is used to grant another owner access to your boat for cross-team data sharing — see Comparing Multiple Boats.
Step 1
Navigate to https://app.sailnjord.com/data
Step 2
Select the boat you would like to add team members to
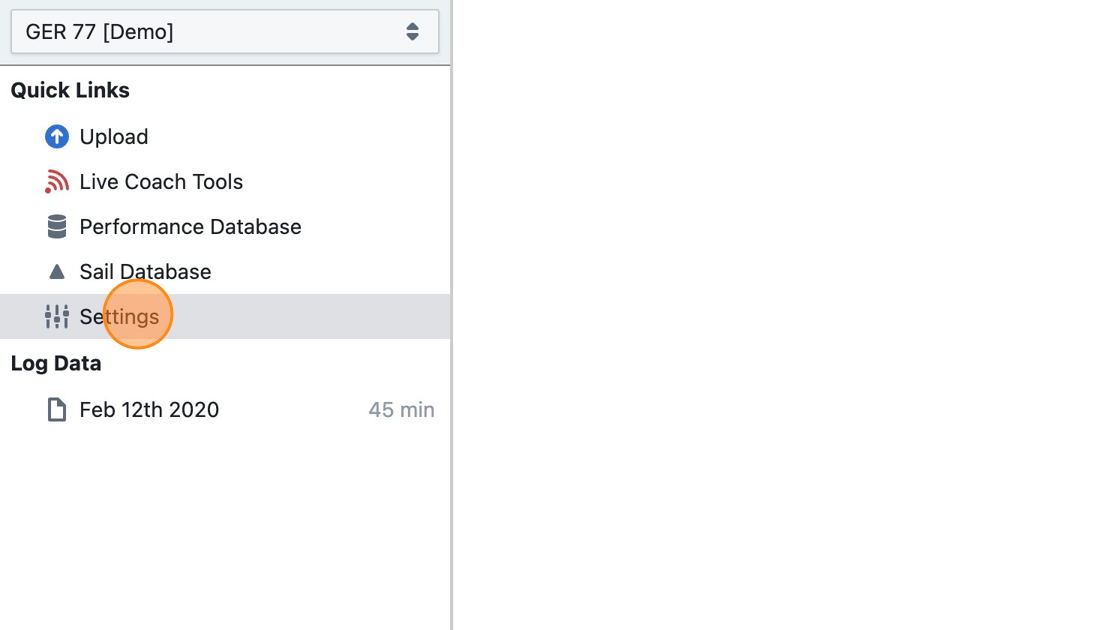
Step 3
Click "Settings"
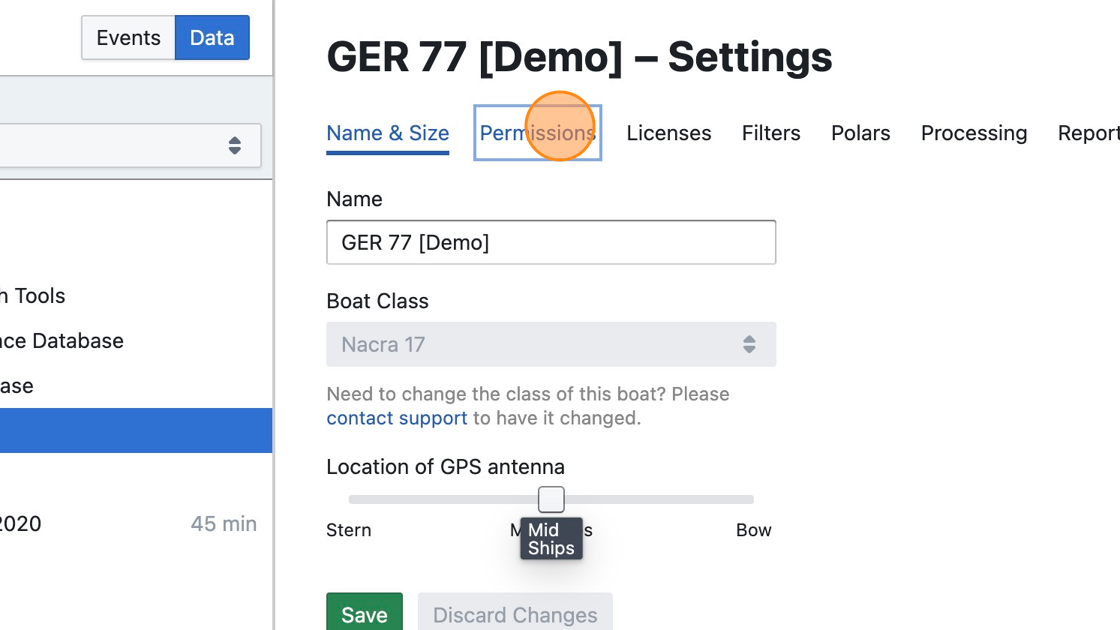
Step 4
Click "Permissions"
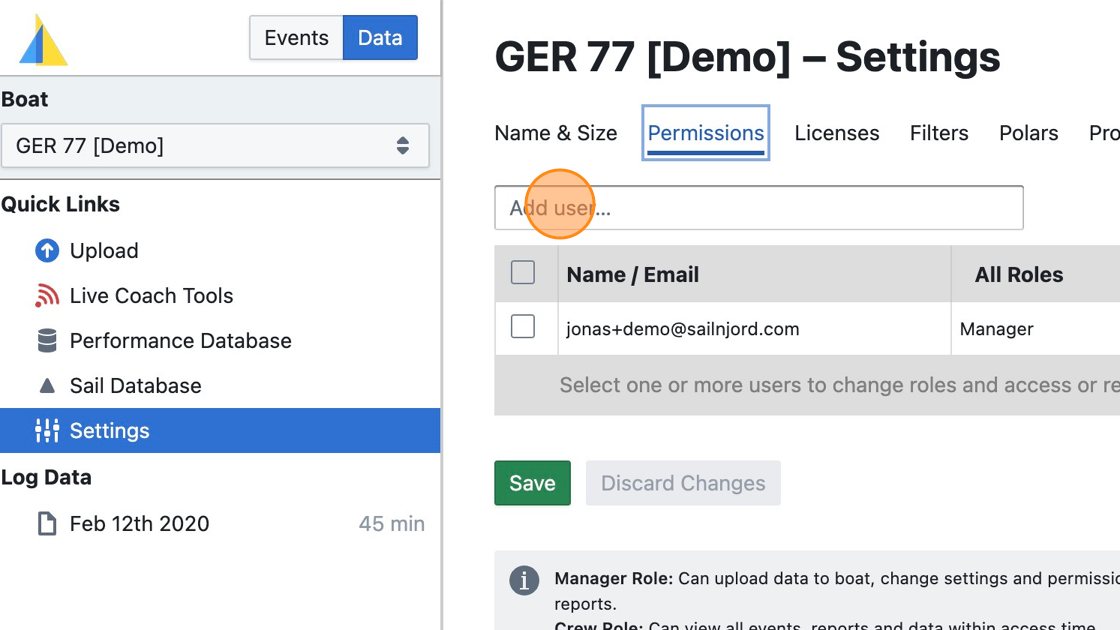
Step 5
Click the "Add user…" field.
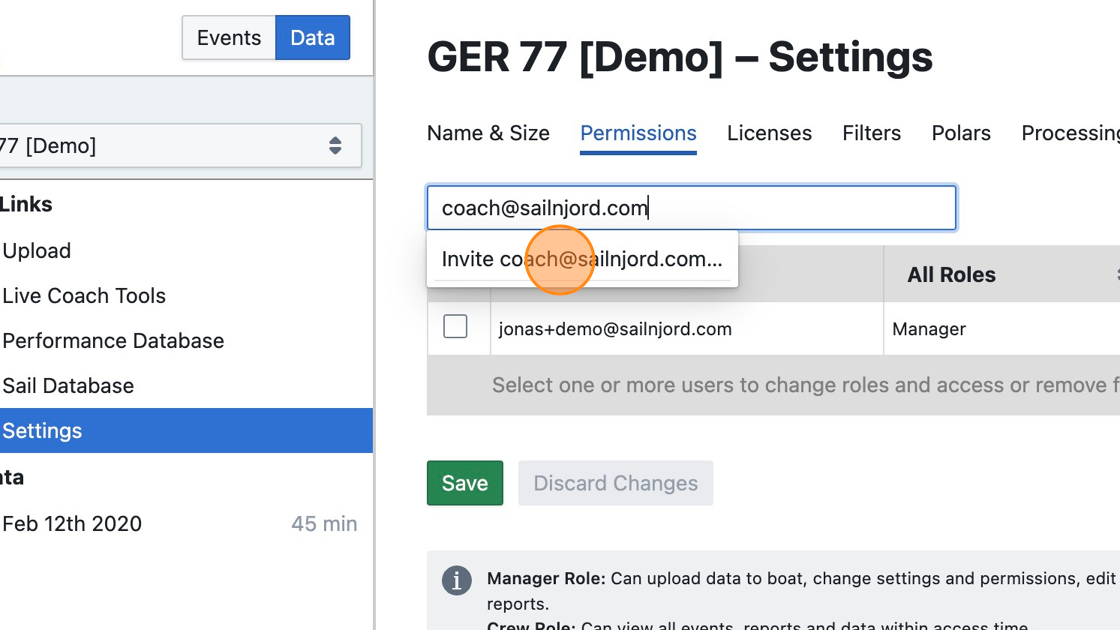
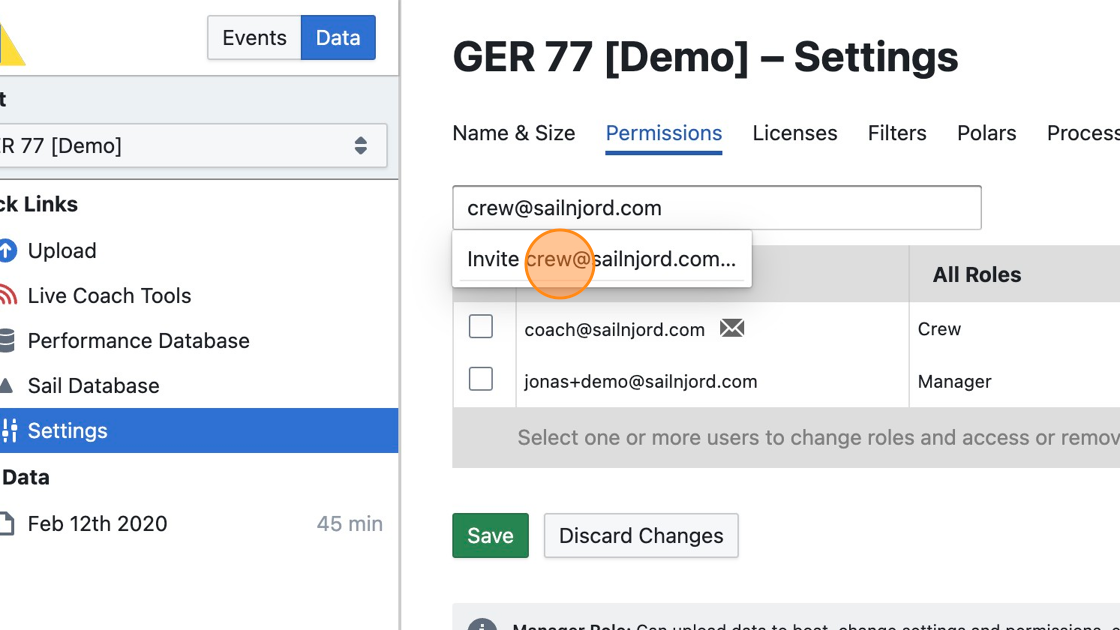
Step 6
Type in the full email address of the team member you want to add, and click "Invite"
Step 7
Repeat as necessary
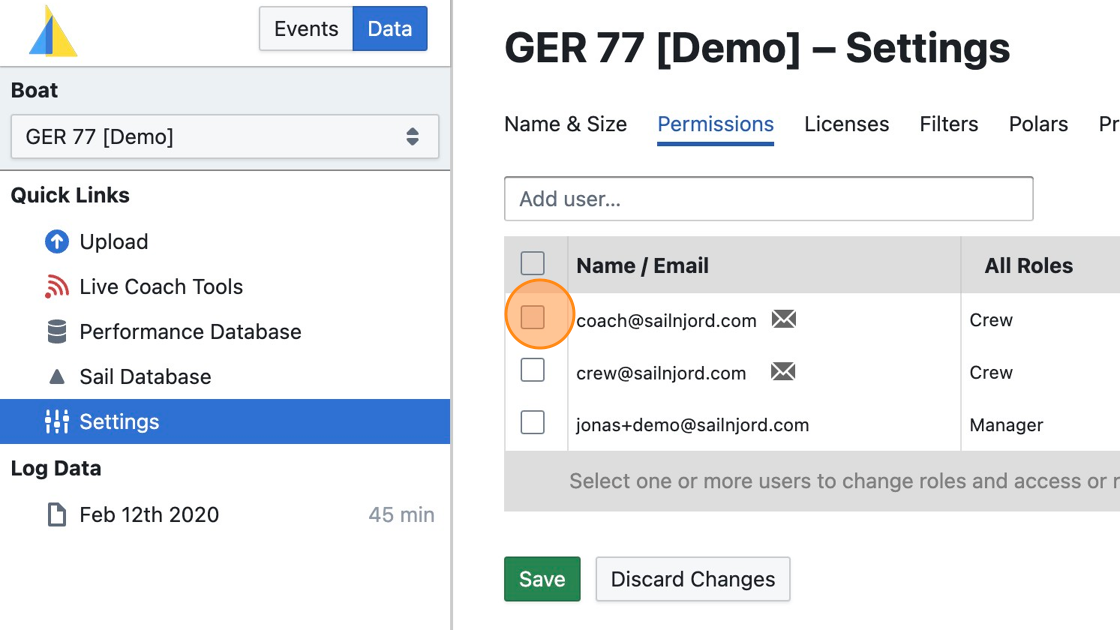
Step 8
Click to select a user (the coach, in this example)
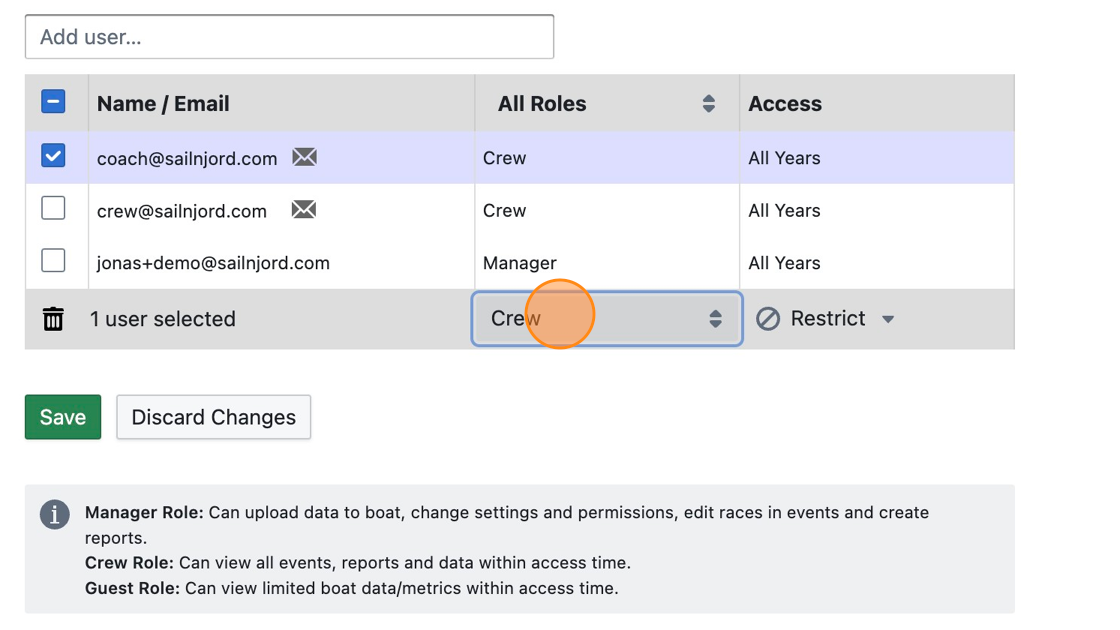
Step 9
From the role selection field, select "Manager" (to allow the coach to upload data to the boat)
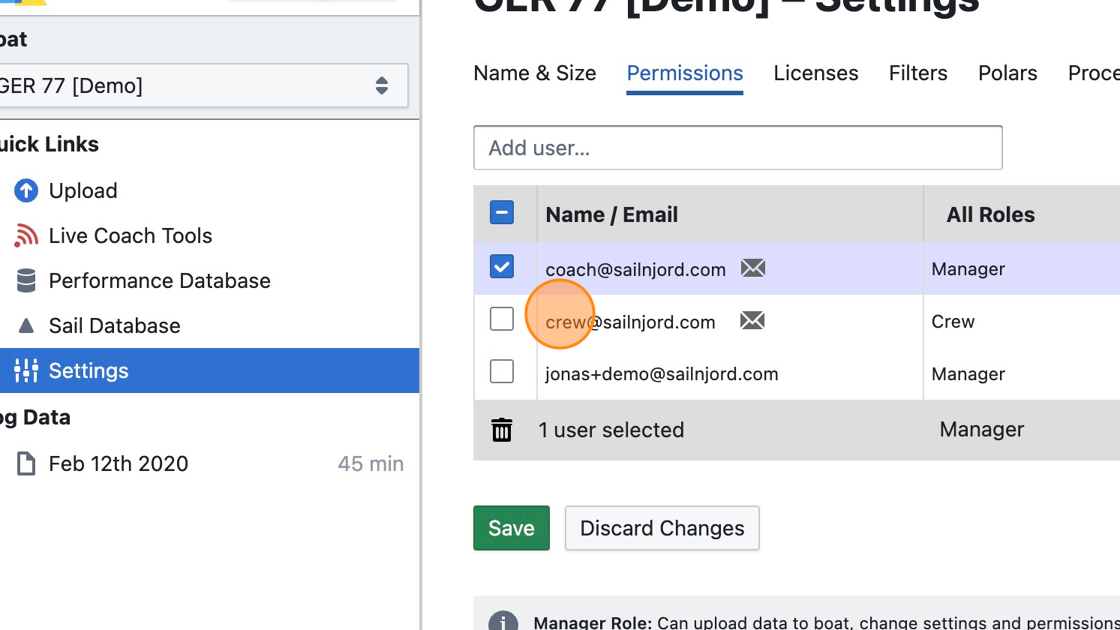
Step 10
Select another user
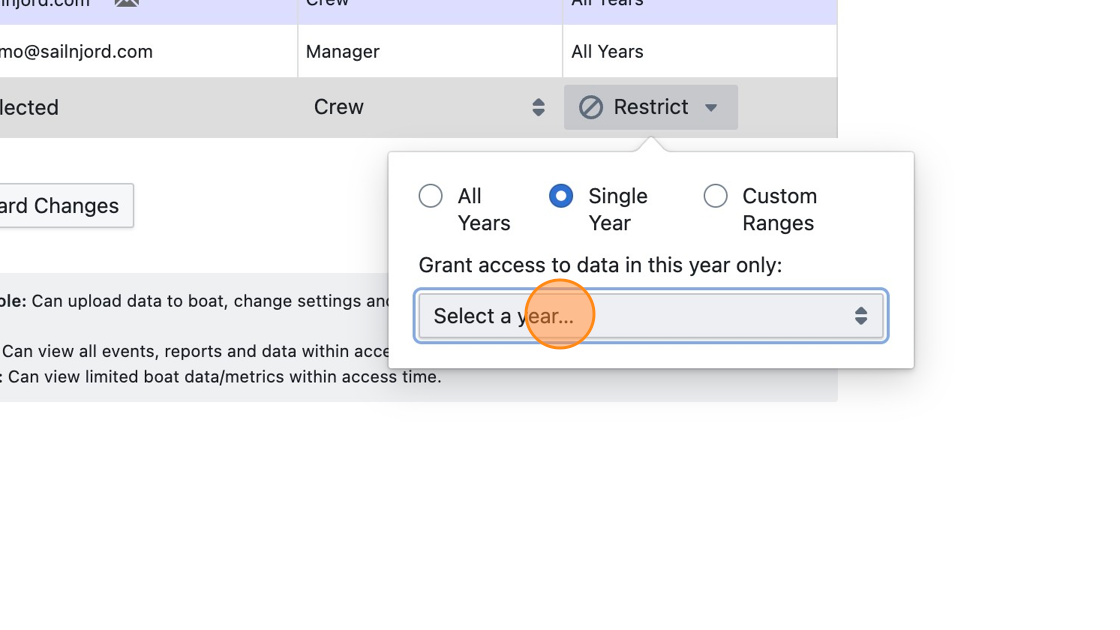
Step 11
Click the "Restrict" field and select a year or date range to restrict the access of a user
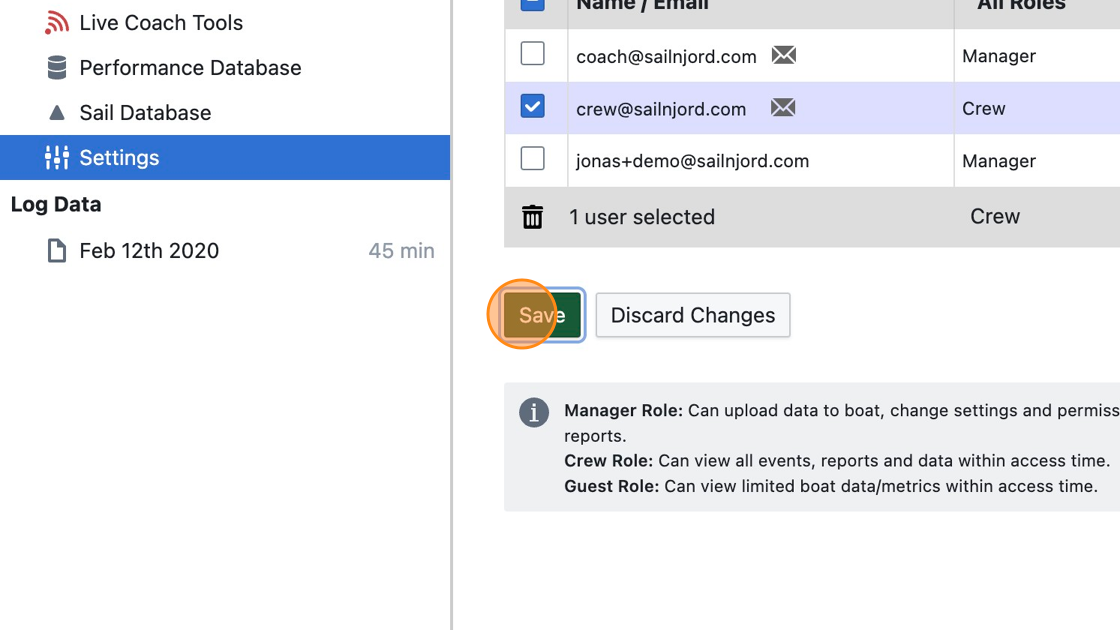
Step 12
Click "Save". Invitation emails will be sent to all added users. The envelope symbol next to an email address indicates that the user has not signed up following the invitation yet.
Comparing Multiple Boats
When two or more boats sail together on the same day and their data is loaded into Njord, the analysis becomes much richer than what is possible from a single boat alone. This page covers why multi-boat data is so valuable, how to set it up, and the licensing scenarios that come up most often.
Why compare multiple boats
The decisive moments are the stretches where two boats "line up" — sailing close together, on the same tack, in essentially the same wind. In those windows you can attribute a speed or height difference to the boats themselves rather than to wind shifts or pressure differences, which is something you can never do with single-boat data alone.
Beyond pure lineups, multi-boat data also lets you:
- Cross-check wind readings between boats — a TWS or TWD discrepancy often points to a calibration issue on one of them
- Compare maneuver execution side by side — same conditions, different techniques
- Use one boat as a reference while testing rig, sail, or trim changes on the other
- Get more reliable TWD inference — the algorithm uses combined maneuver geometry from all boats
Almost every view type in Njord Analytics supports multiple boats. The most useful for direct comparison are:
- Map — overlaid tracks; the Ladders tool draws lines between the boats' positions at equal times for a clear visual lineup
- Statistics / Gain Loss — gain/loss between two boats broken into forward, sideways, and VMG components
- Line Chart — overlay any metric (boatspeed, TWA, heel…) from all boats on the same axes
- Scatter Chart — reference areas highlight each boat's mean ± standard deviation for quick visual comparison
Getting set up
Two things have to be true for you to compare boats in Njord Analytics:
1. You need access to all the boats
Access is granted per boat. If you created the boats yourself in your own account you already have it; otherwise the owner of the other boat needs to add you as a user on their boat. See Sharing Boat Access.
Each boat keeps its own list of permitted users, so sharing in both directions takes two steps: you add the partner team's email to your boat's permissions, and they add your email to theirs. Once both are done, both teams can see both boats.
Tip — finding the right contact on a partner team: Knowing that "boat X is on Njord" usually isn't enough to set up sharing. You need to identify the person on that team who manages their Njord account and the exact email address they use. It may be the owner, a coach, or a designated team member, and the boat itself may be named by sail number, full name, or sit under a coach's account — so you can't reliably guess the email from the outside. The fastest way is to ask the team directly: "Who handles your Njord account, and what email does it use?" Then exchange email addresses so each side can add the other to their own boat's permissions.
2. All the boats need to be in the same event
When the second (or third) boat's data is uploaded, it usually lands in a new auto-created event by itself. Add it to the existing event rather than creating a new one — analysis only works across boats that share an event.
There are two ways to do it:
Option A — from the event:
- Open the event
- Cogwheel menu (bottom right) → Edit Event
- Add the boat to the Boats field, click Update
Option B — from the uploaded-data page of the second boat:
- Open the uploaded-data page for the boat
- In the Events list, uncheck Show events with <boat> only
- Events for other boats you have access to will now appear, each with an Add <boat> to event button
License considerations
Once you've decided you want to compare with another boat, the practical question is who pays for what. The right setup depends on how the boats are owned and how the teams work together.
Fleet, club, or federation buying for several boats
A single Njord account holds the license, and that license covers all the boats in the fleet (e.g. an Olympic squad's coach account, or a club account for its J/70s). Adding more boats to the license unlocks volume pricing — the per-boat price drops as the fleet grows. The boats are all created under the same account, with team members added per boat as needed.
This is the simplest setup for any group where one entity has overall responsibility for the fleet's analytics.
Independent owners sharing data with each other
Each owner has their own Njord account and their own boat. Owners then grant each other access via Sharing Boat Access, and at the end of each sailing day each owner uploads their own data to their own boat. Everyone with shared access then sees all boats in Analytics (and can pull them into Njord Player for debriefs).
In this setup each owner pays for their own boat's usage independently — daily, monthly, or annual, whichever fits their schedule (see Setting up Payment). Volume discount does not apply across separate accounts; it only applies when multiple boats are billed to the same account.
If the partner team only uses Njord Player and not Analytics: sharing through Analytics isn't available to them, so log files have to be sent manually after each day, and each team needs its own Player license for the boats whose data they want to load. In special cases a custom arrangement may be possible — please contact us.
Two boats owned by the same team for in-house testing
Both boats belong on a single license under one account. This unlocks the two-boat volume discount and keeps all the data in one place, ready for direct comparison.
If you're not sure which scenario fits your situation, contact us — we'll help you set it up.
Adding Wind Data
True wind direction is the key that unlocks the most powerful parts of Njord Analytics — leg detection, maneuver analysis, VMG, and polar targets all depend on it. If your boat doesn't record wind data, there are several ways to add it.
Wind direction (TWD) enables TWA and VMG, drives automatic upwind/downwind leg detection, and is required for maneuver detection and analysis.
Wind speed (TWS) adds context for record keeping and puts performance numbers in perspective. Some features, including target analysis and polar comparisons, only work when TWS is present.
When does TWD inference work well?
Inference works best with clean straight upwind/downwind sailing, clear tacks and gybes, consistent wind direction, and good boatspeed data (paddlewheel preferred over GPS SOG). It works less well in light, shifty, or puffy conditions, on reaching-dominated courses, or when maneuvers are short and messy.
If inference drifts mid-day: Limit the inference time range to start at the first start, and enter an initial TWD seed value such as the bearing of the first start line. For days with significant wind shifts between races, re-run inference separately for each segment with its own wind conditions rather than covering the whole day in one pass.
With multiple boats: TWD inference is more reliable when several boats' data are loaded into the same event — the algorithm uses combined maneuver geometry across all boats to better constrain the solution.
If inference fails entirely: Try "Weather Data" or a manually entered constant TWD. Defining a full race course (all marks) also helps — leg boundaries derived from mark roundings are more robust to wind shifts than TWA-based detection alone.
Adding wind from a coach boat file
A wind file from a coach or chase boat can be used to supply TWD and TWS. The file must either contain TWD/TWS directly, or contain AWA + AWS + Heading (or COG) + BoatSpeed (or SOG) so Njord can calculate the true wind from the coach boat's data.
To include wind channels beyond TWD/TWS (e.g. gust), upload the wind file as a second file alongside the main log in the same upload — do not use the Events → Wind tab, which copies only TWD and TWS. The "low sample rate" warning shown for wind files can be ignored — Njord interpolates the wind data when merging.
Step 1
Navigate to https://app.sailnjord.com/
Step 2
Click "Wind"
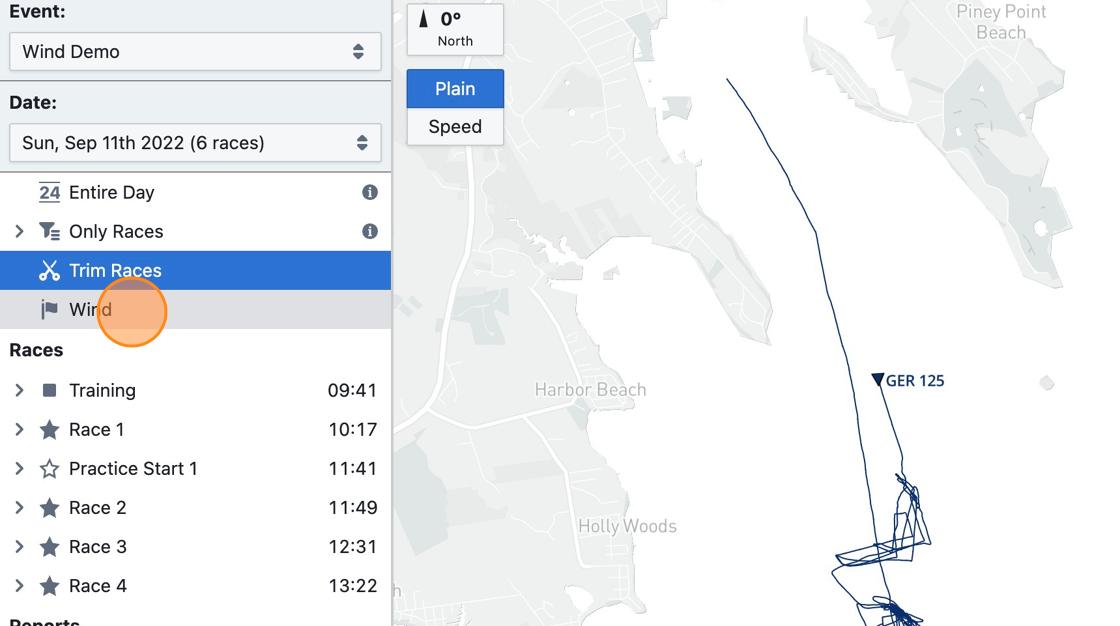
Step 3
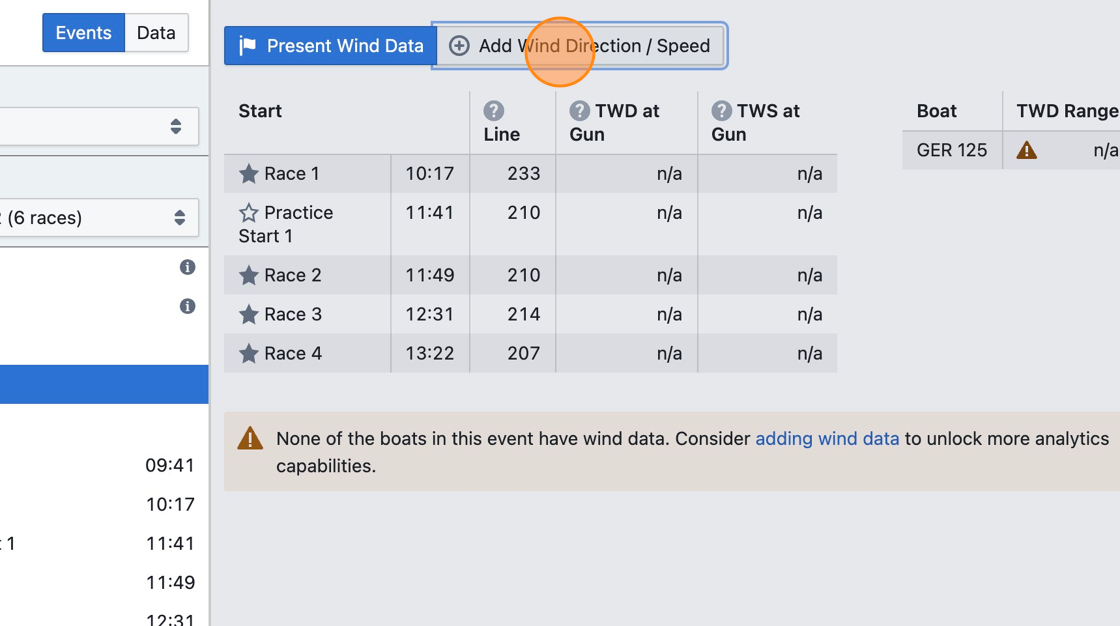
You will see an overview of race times and boats in the selected event, with an overview of available wind data for each race and boat.
Step 4
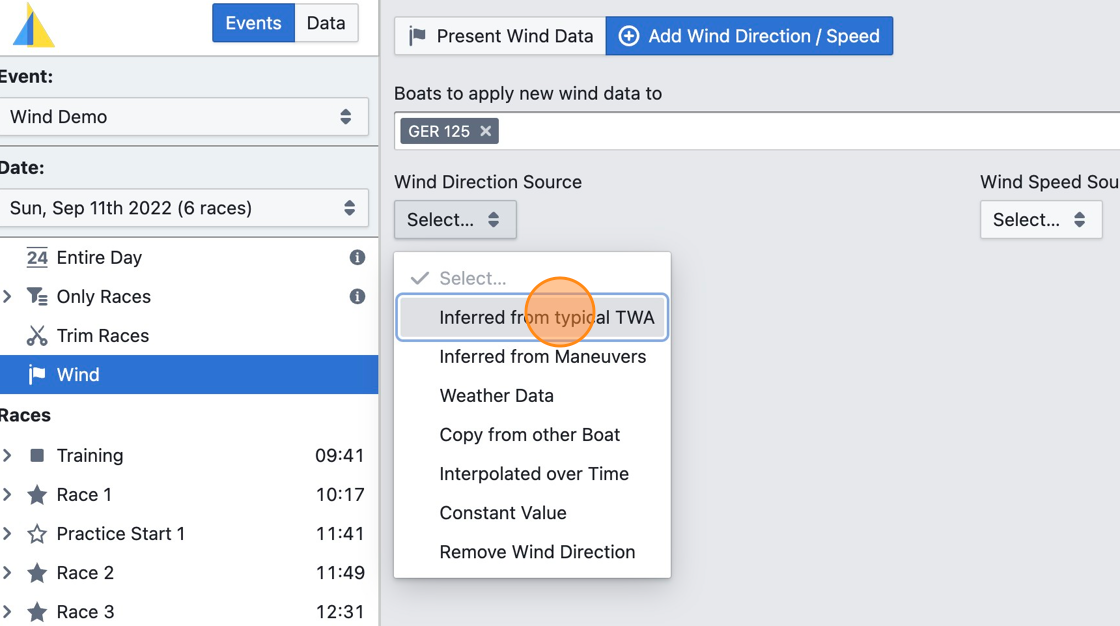
Click "Add Wind Direction / Speed"
Step 5
Select "Inferred from typical TWA" for "Wind Direction Source".
This option is recommended if your sailing on that day consists of good straight line upwind/downwind sailing and clean maneuvers. Otherwise, try using the "Weather Data" option or entering wind direction manually ("Constant Value" or "Interpolated over Time" options).
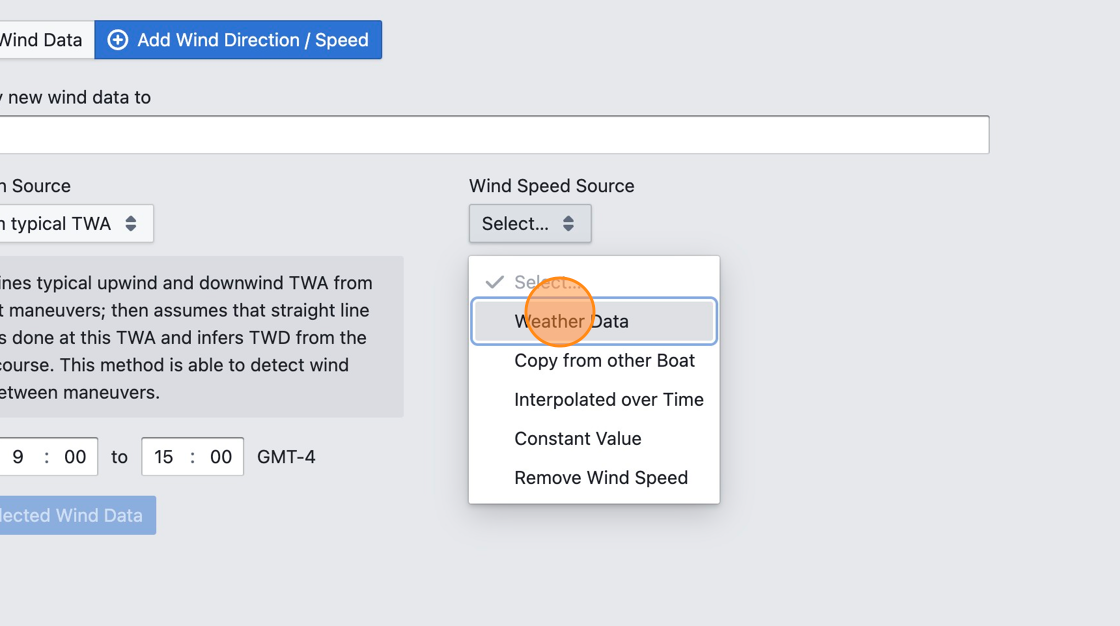
Step 6
Select "Weather Data" for "Wind Speed Source".
This option is recommended if you don't have any wind speed measurements on that day. Otherwise, consider entering wind speed manually ("Constant Value" or "Interpolated over Time" options).
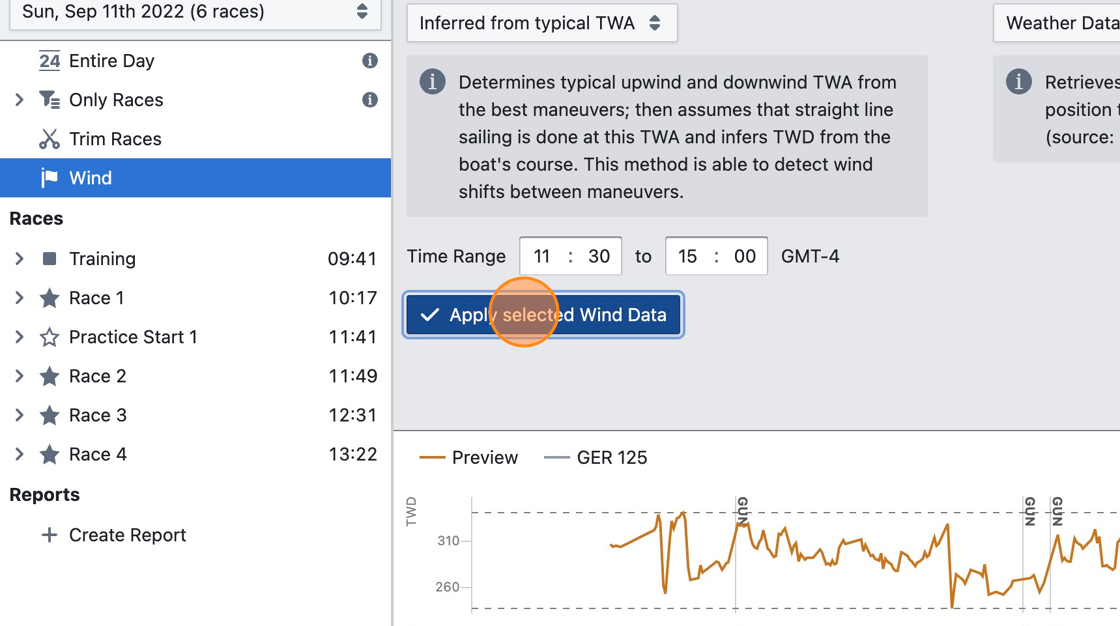
Step 7
Wait for the orange "Preview" line to load in the charts below and verify that the wind data is accurate enough to be usable. If it isn't, try different settings.
Step 8
Click "Apply selected Wind Data"
Step 9
Click on a race, which should now be broken into legs due to TWA data being present.
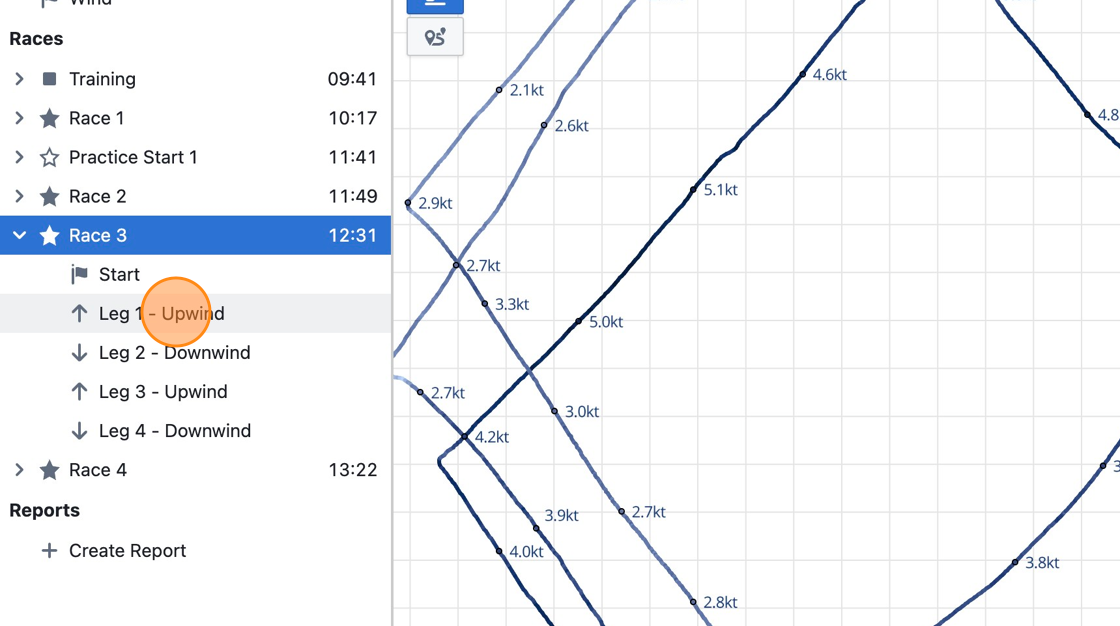
Step 10
Using TWA data, maneuvers can be detected and analyzed. Select the map view and click on "Maneuvers".
Step 11
Maneuvers are highlighted along the boat's track and maneuver loss is displayed.
Loading Extra Data Files
Njord lets you combine data from multiple files in a single session — for example, pairing a main GPS log with heart rate from a smartwatch, load cell data from a mast sensor, or events from a Sailmon. Any channel from the extra file is merged with the boat log and available in all visualizations.
See also: Data Overview — File Purpose
Step 1
Navigate to https://app.sailnjord.com/data/
Step 2
Select the boat you want to load data to
Step 3
Click "Upload"
Step 4
Click "Add Files…"

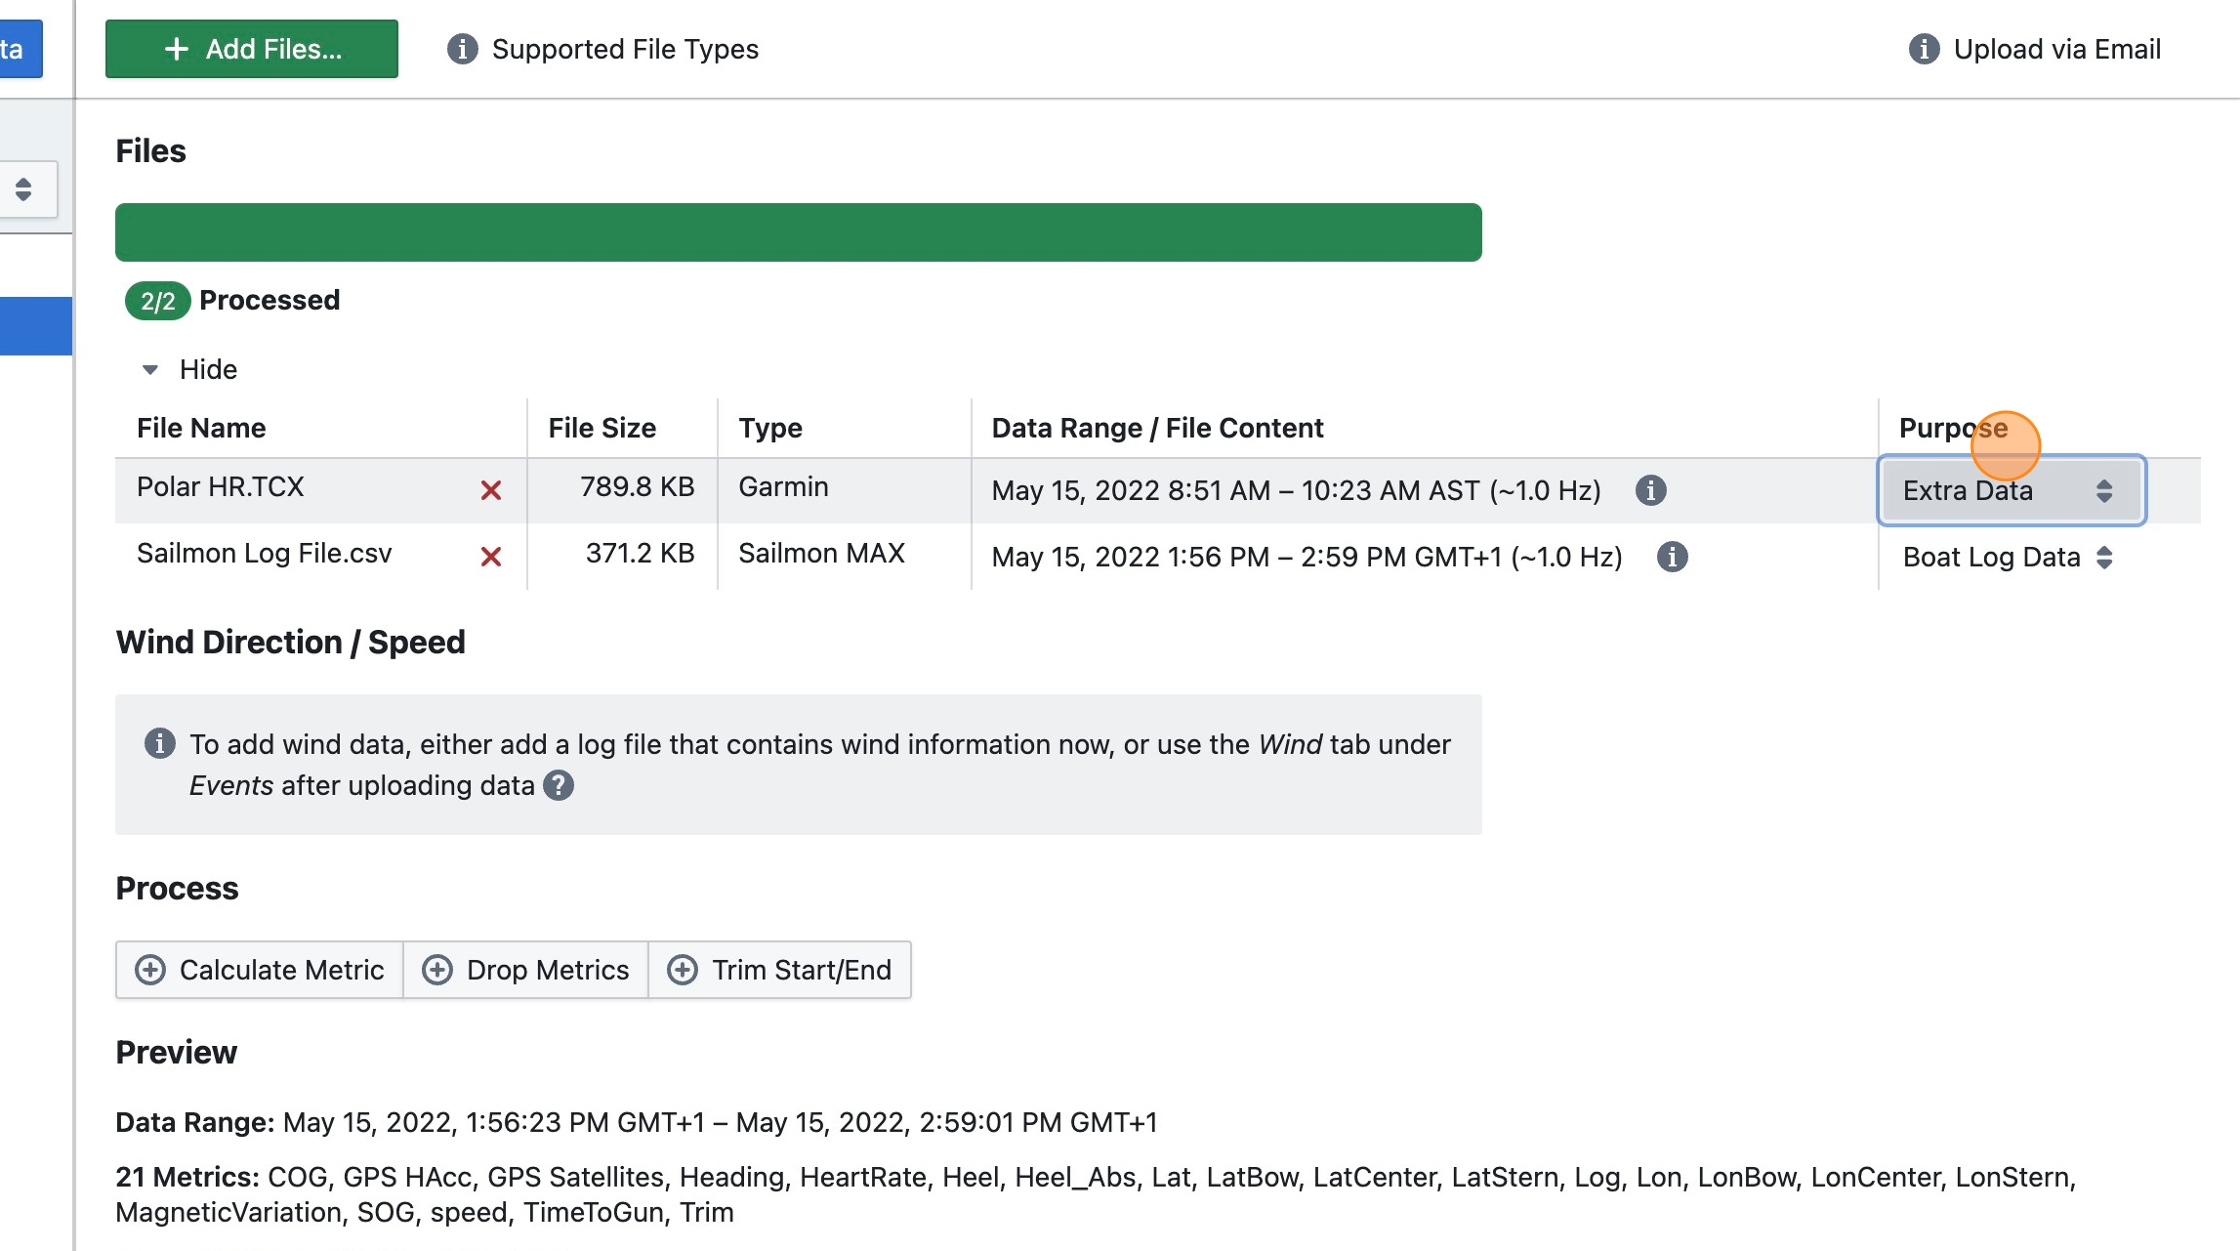
Step 5
Select two files:
-
The boat log data file (here: "Sailmon Log File.csv") recorded from the boat's instruments (e.g. Vakaros, Sailmon, Velocitek tracker, or others) containing GPS data etc.
-
An extra data file (here: "Polar HR.TCX") containing heart rate data (from a smartwatch), or load cell data (from a Cyclops sensor), or similar, which will be joined with the GPS base data
With the same technique you can also add more than one extra data file, each will be joined with the boat log data - i.e. any metrics contained in the extra data file that are not in the boat log data file will be taken from the extra data file. For example, if both the boat log file and the extra data file contains GPS data, GPS data will be used from the boat log data file, not the extra data file.
Tip: Learn more about supported data sources at https://www.sailnjord.com/data-sources/
Step 6
Ensure that for the extra data file (here: "Polar HR.TCX") the Purpose field is set to Extra Data
Step 7
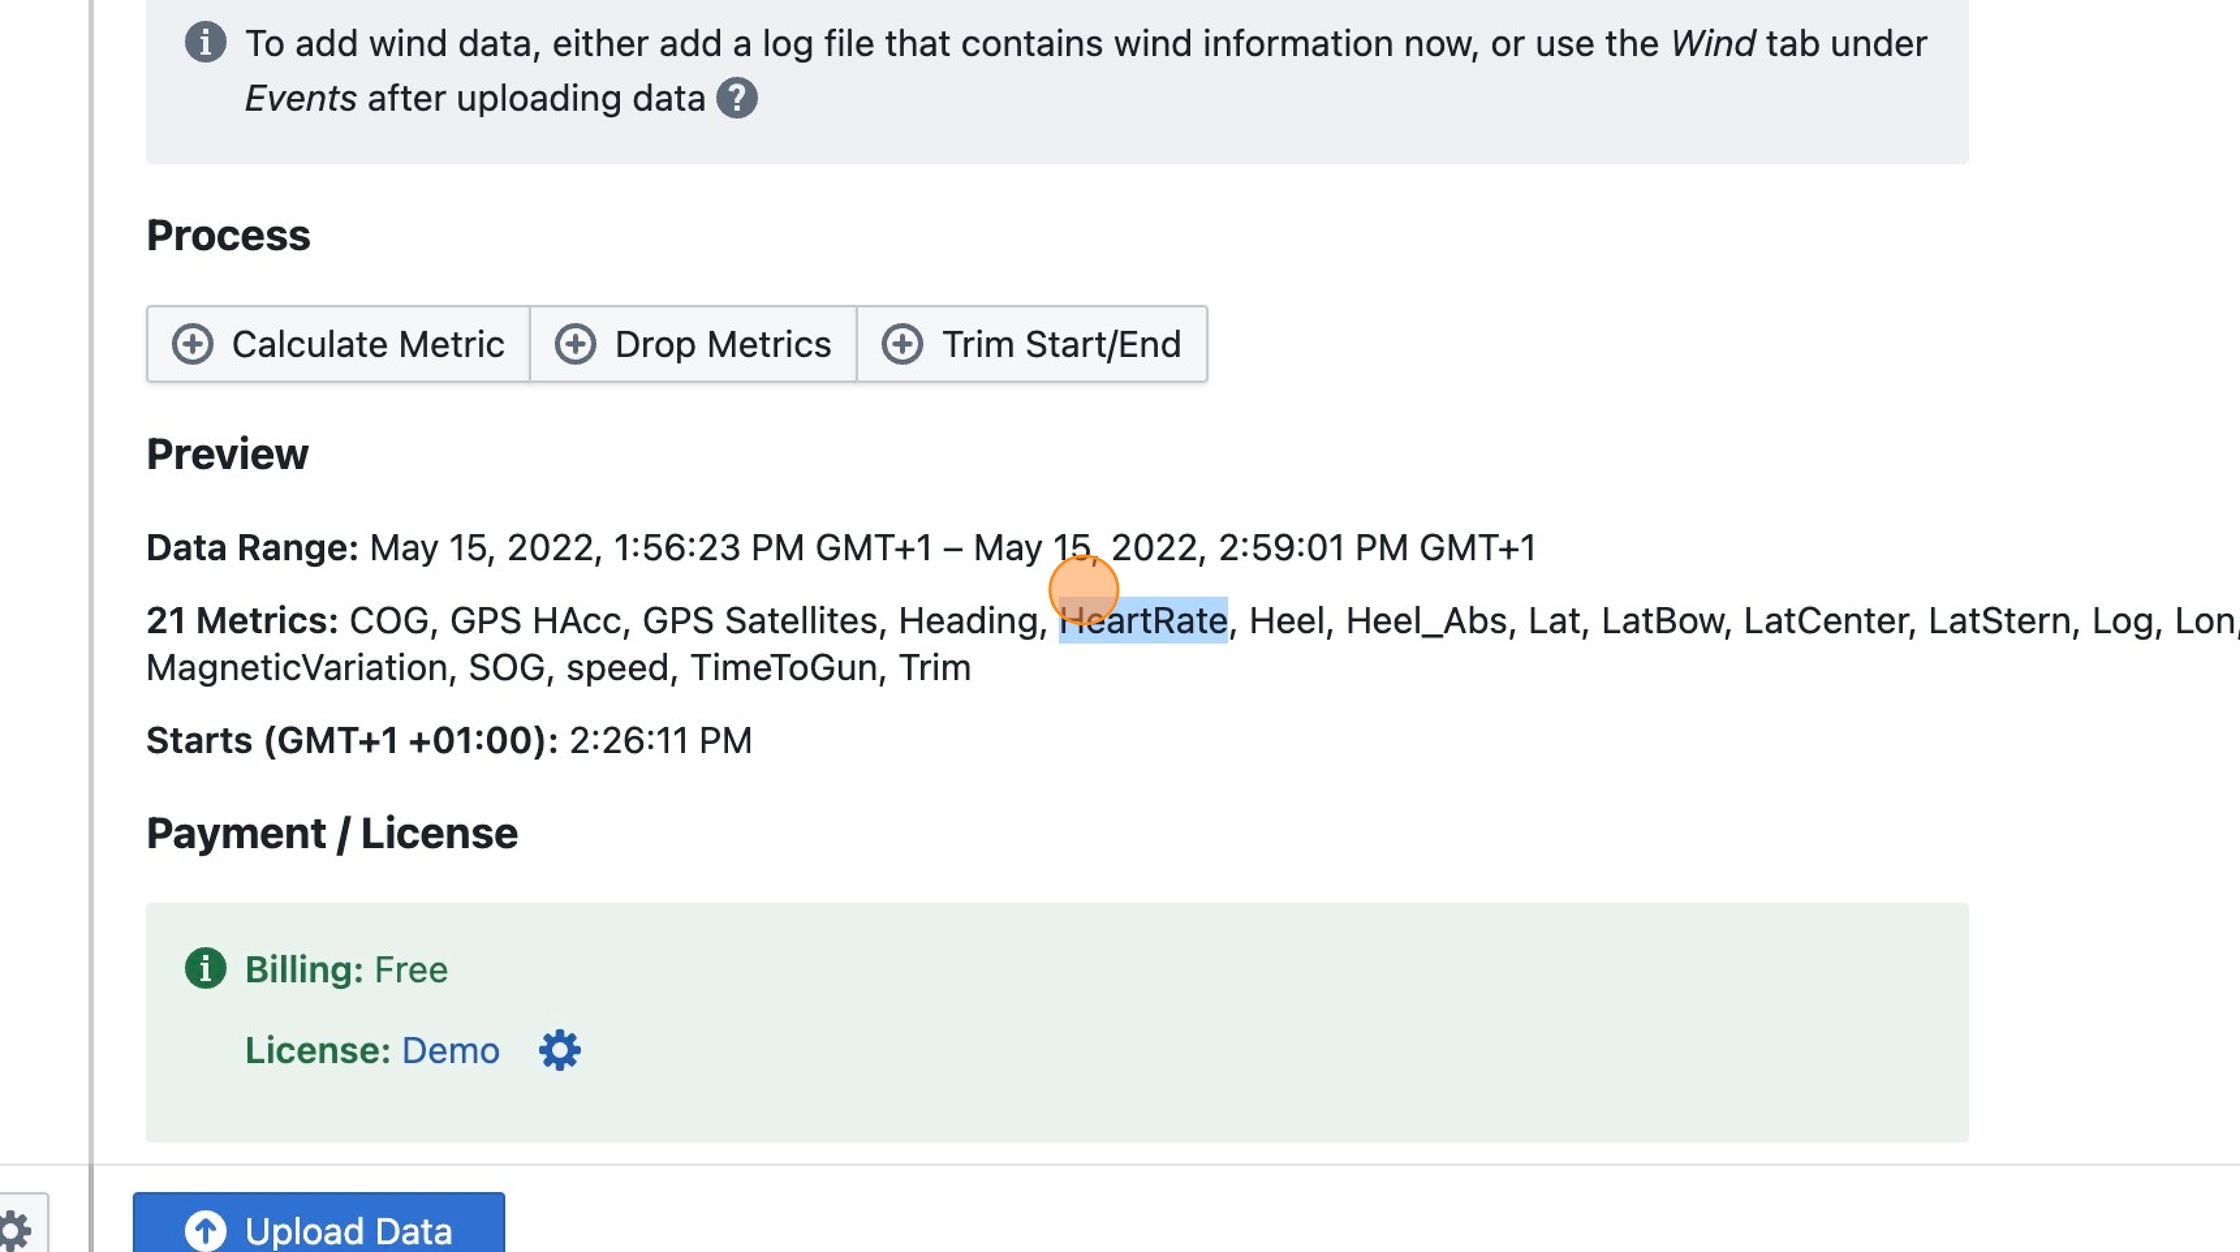
Note that the data from the extra data file appears in the preview
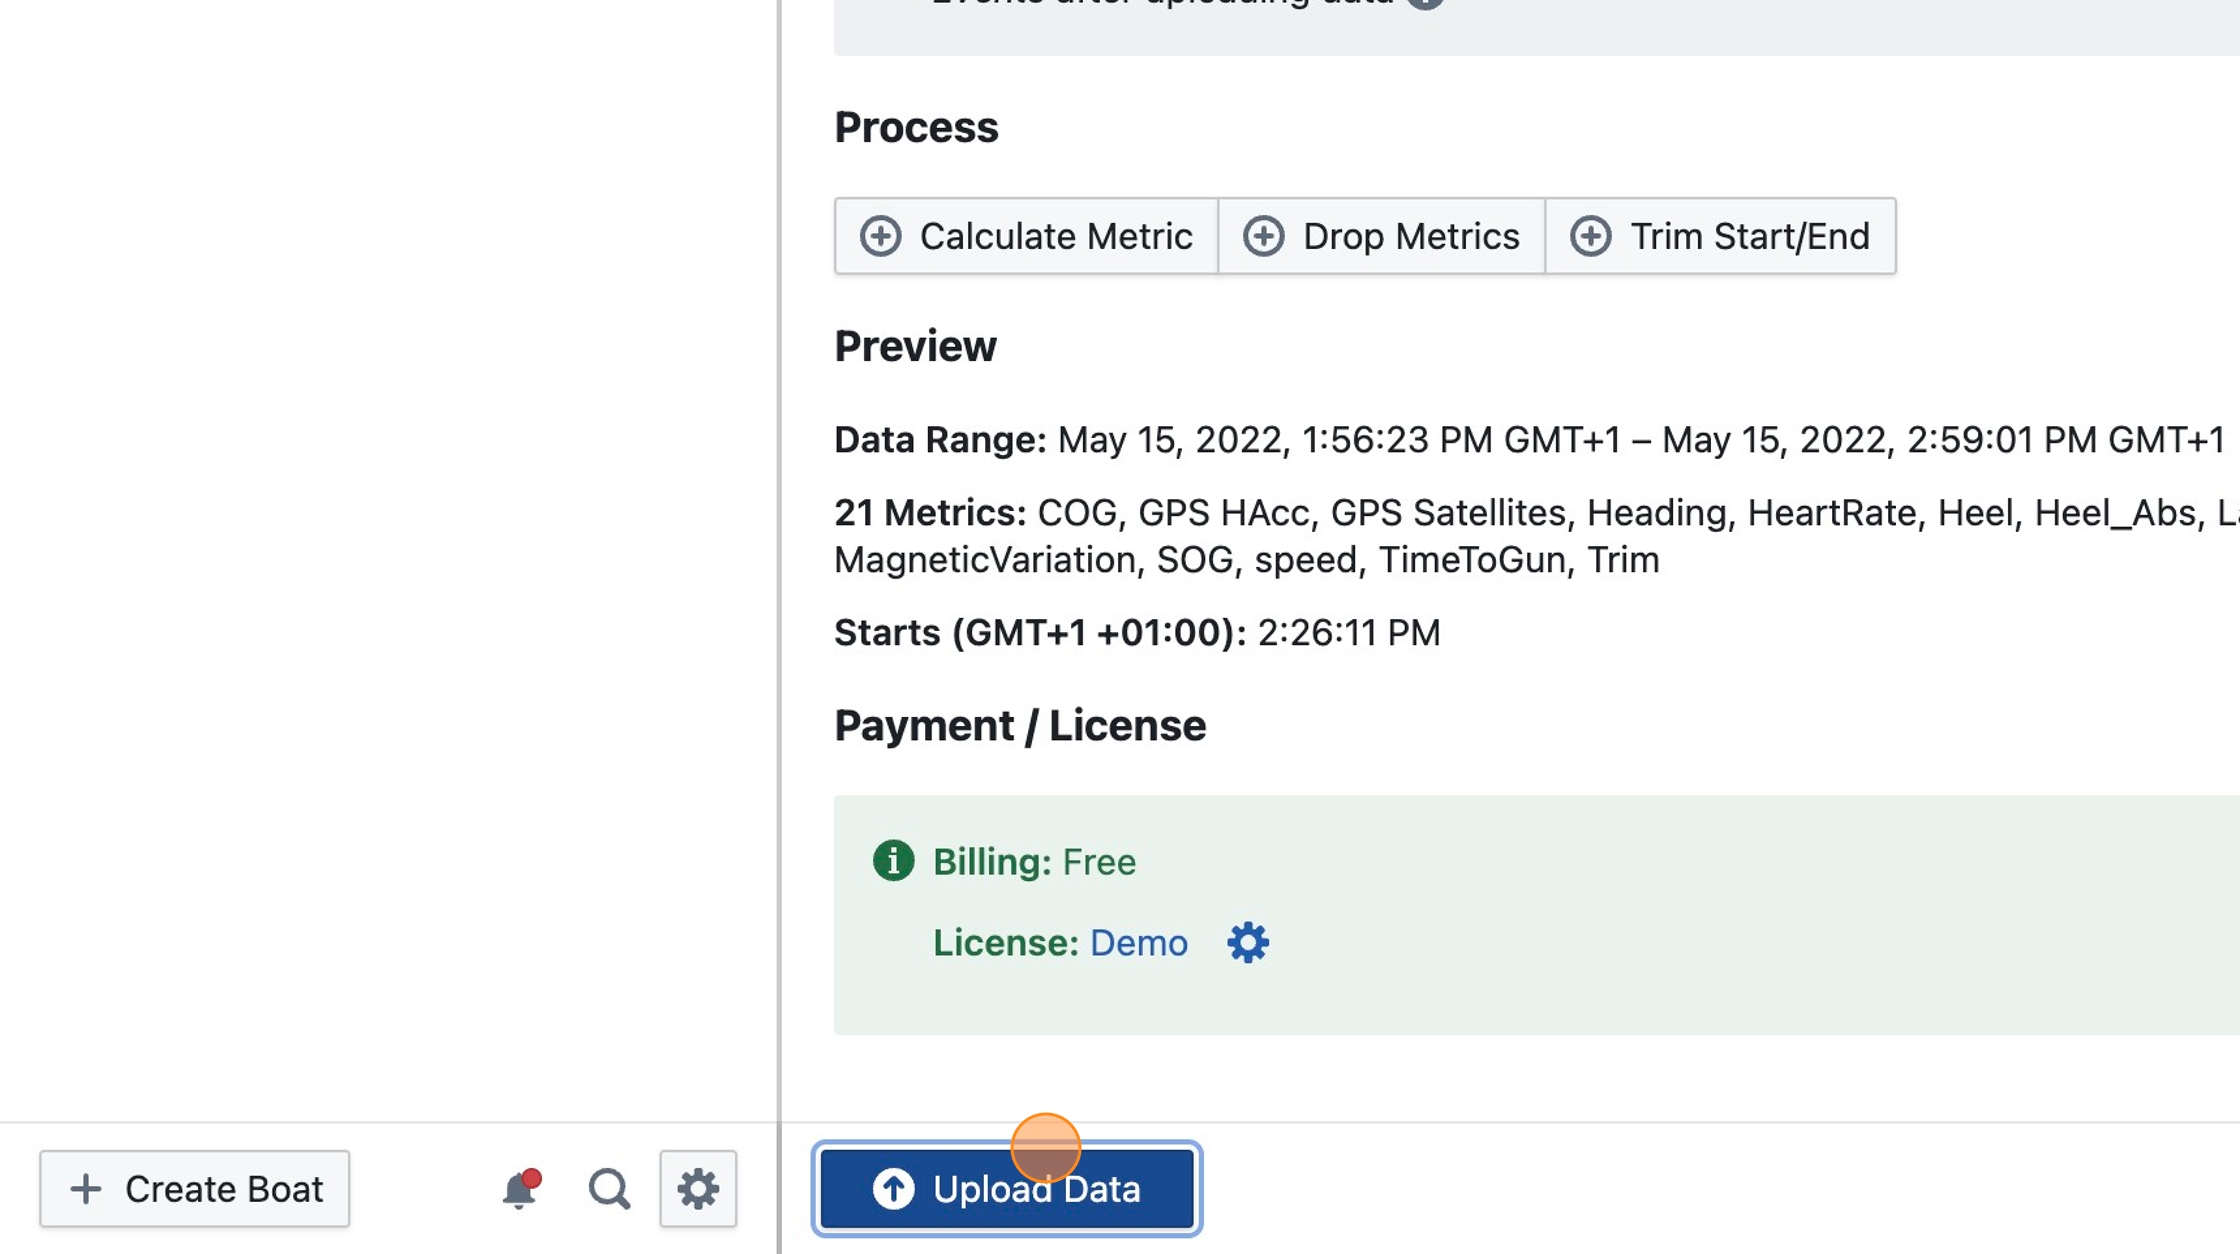
Step 8
Click "Upload Data"
Step 9
Proceed to create an event to view your data as described in Upload Boat Data steps 10-13
Step 10
Select HeartRate to display it in any visualization
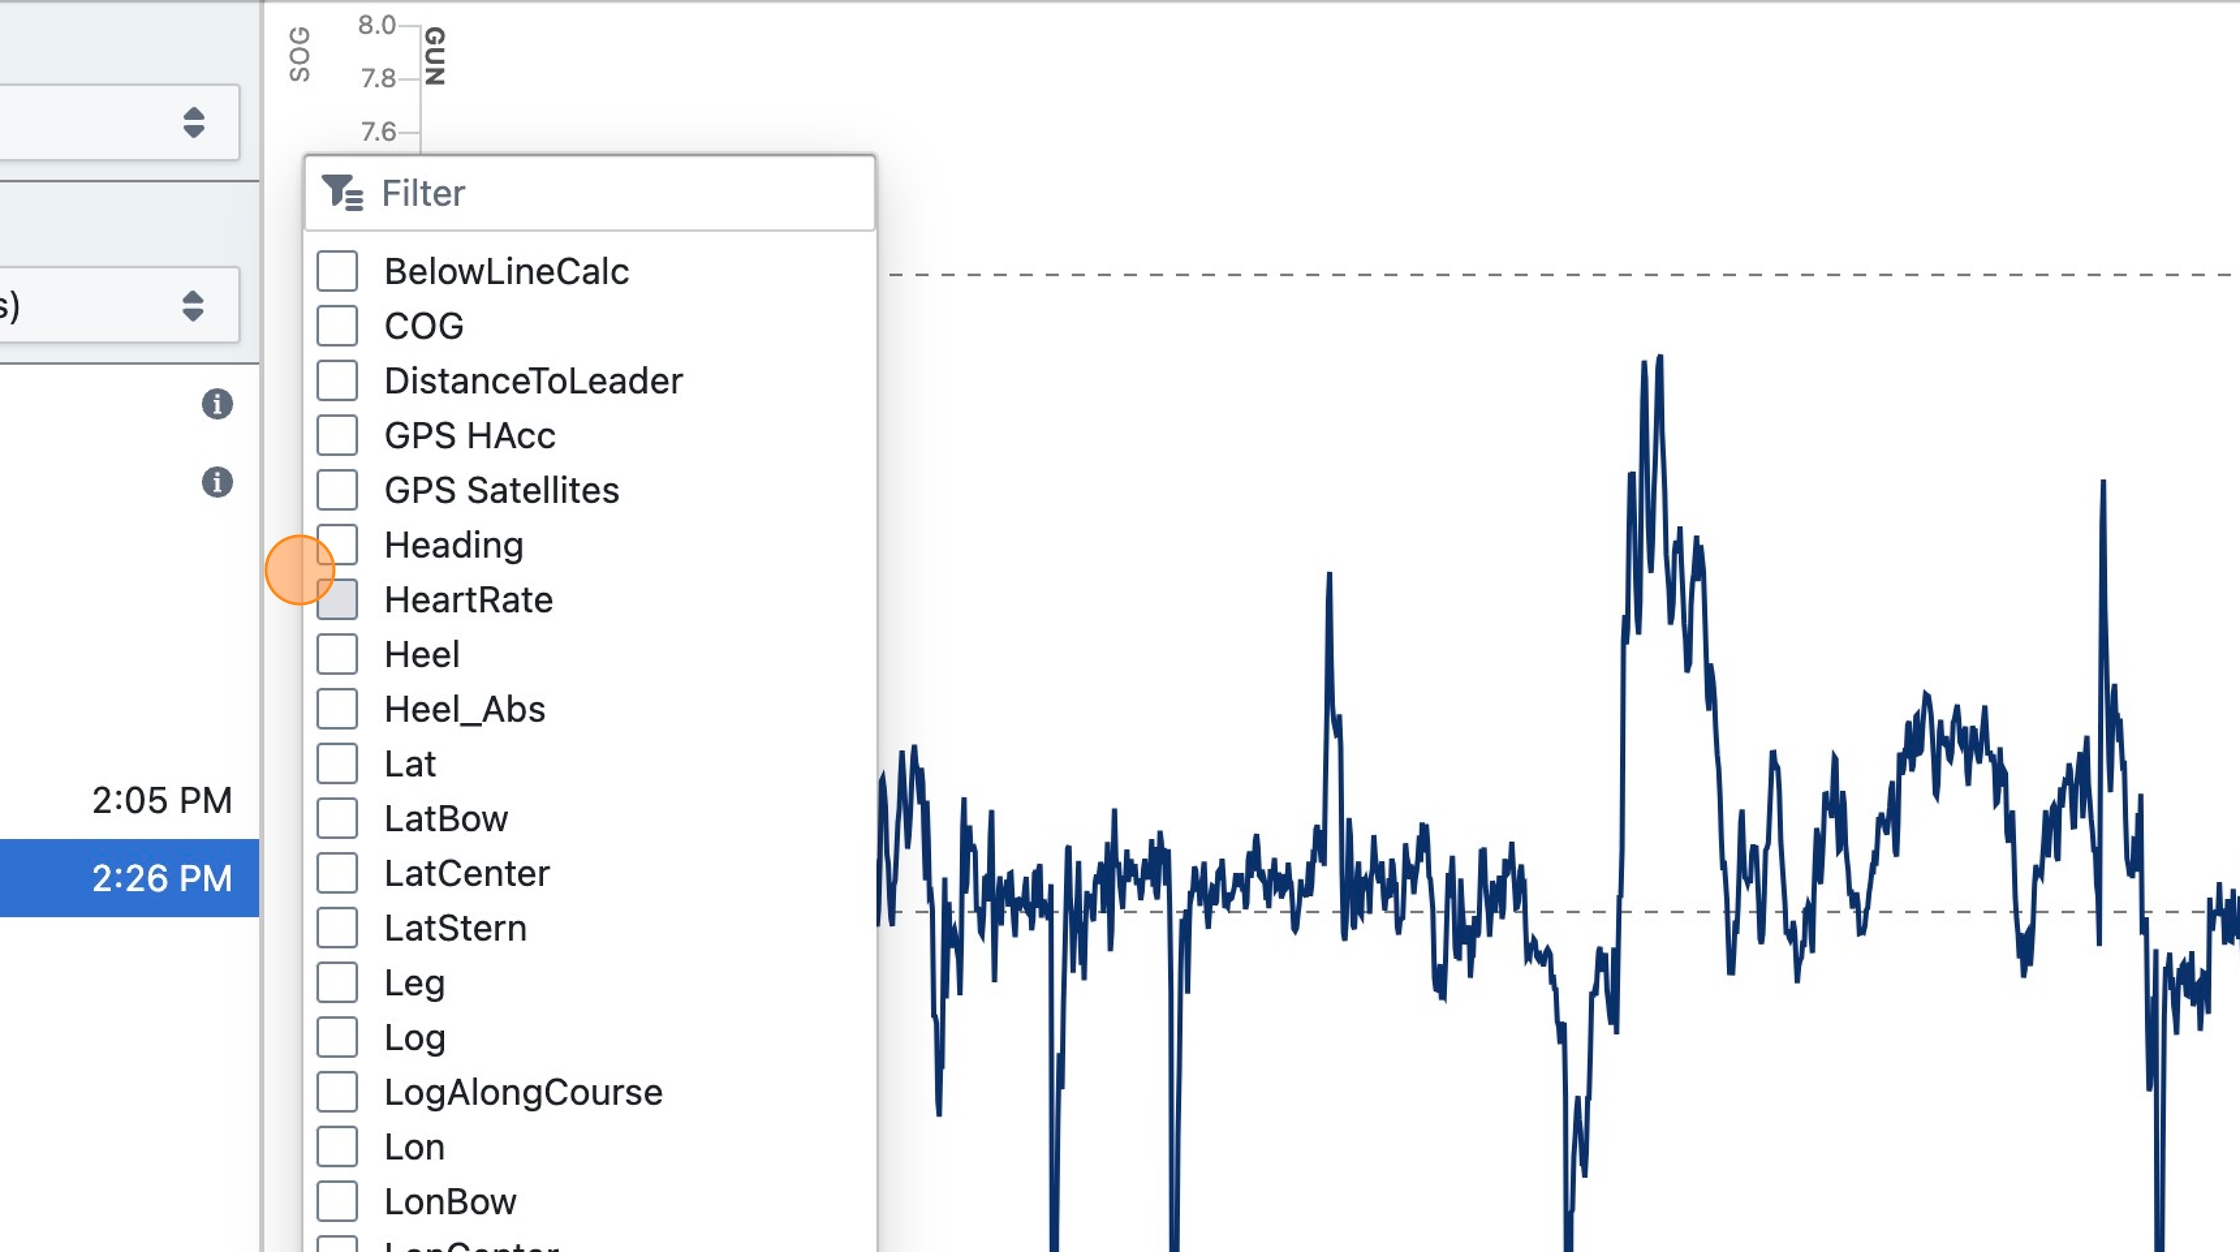
Step 11
Heart rate data can now be analyzed alongside other boat data such as SOG, Heel, etc.
Live Coach Tools
Live Coach Tools is a mobile web app for logging information on the water in real time — no installation required, works on any smartphone browser.
To open: Go to app.sailnjord.com/data/, select your boat, and choose Live Coach Tools from the sidebar.
What you can log
- Race times — mark race starts and finishes, lineups, and speed tests
- Comments — tap to add a timestamped note at any moment
- Sail changes — record which sails are up and when they were changed
Where the data ends up
After the session, when the log file is uploaded to Analytics, all coach data is matched to the boat data by timestamp:
- Comments and sail changes appear in the Sails / Comments view in Analytics
- Comments appear as markers on the Player timeline, so you can jump straight to annotated moments in the footage
Offline use
Live Coach Tools works without a network connection. All data is stored on the device and syncs to Analytics automatically when connectivity returns.
Live Data
Live Data streams your boat's instrument data to any phone or tablet browser in real time — so a coach on the chase boat, a tactician ashore, or anyone following the session can watch boatspeed, wind angle, VMG, and more as the boat sails. No waiting until the dock to see what was happening on the water.
Setup
Live Data requires a one-time configuration to connect your instrument system to Njord. To set it up, go to app.sailnjord.com/data/, select your boat, and choose Live Data from the sidebar. This will show setup instructions, including the IP address and port to enter in your instrument software.
Expedition is the most common setup; NMEA 0183 streaming is also supported. The yacht needs an internet connection — 4G, 5G, or Starlink.
Contact support if you need help with the instrument configuration.
Important: The computer or device running Expedition (or other streaming software) must have its system clock set accurately. Live Data timestamps are taken from that clock — if it is wrong by minutes or hours, the data will appear at the wrong position on any timeline display.
Viewing live data
Once the boat is set up and streaming, go to app.sailnjord.com/data/, select your boat, and choose Live Data from the sidebar. Multiple devices can connect simultaneously with no limit.
The display shows number readouts and rolling line charts for all metrics being streamed (typically wind direction and speed, boatspeed, VMG, heel, and any other logged channels). The rolling window shown is configurable (10 seconds to 10 minutes or longer depending on your setup).
Diagnosing connection issues
If the live display is blank or not updating:
- Check the instrument software is streaming. In Expedition, verify the UDP output is enabled and pointing to the correct IP address and port shown in Njord's Live Data setup page.
- Check the boat's internet connection. The yacht needs 4G, 5G, or Starlink.
- Reload the Live Data page in your browser — the connection is a WebSocket and occasionally needs a manual refresh to reconnect after a network interruption.
- Check the Njord Live Data setup page for the "Last received" timestamp — this confirms whether Njord's servers are seeing any incoming data at all.
Saving live data
By default, streamed live data is not stored persistently — it is only available in the rolling live display and is discarded after the session. If you need to download the day's data after sailing, contact support to enable server-side recording for your boat. When enabled, the streamed data can be downloaded at the end of the day as a log file.
For a permanent record with full analysis, upload your instrument's own log file at the end of the day as usual.
Njord Live App
The Njord Live App runs on any Windows or Mac computer and allows receiving both the live data streamed via the Njord online service (same as above) as well as local network data streams sent from the yacht, with automatic switching between the two sources. This allows you to receive data from the yacht via WiFi/LoRa when in range, and via 5G/Starlink otherwise.
For programmatic access to the live data stream, see the Live Data API.
Performance Database
Every day you sail with Njord, you're building something more valuable than just that day's analysis. The Performance Database stores pre-aggregated summaries from each event so you can compare polars, track how a rig change played out across different wind ranges, and watch your boat's performance evolve over a whole season — or multiple seasons.
Unlike ad-hoc multi-event loading, the database works at scale. Data is averaged into fixed-duration phases at the time each collection is created, so season-long comparisons are fast regardless of how many events you include.
How it differs from ad-hoc multi-event analysis
Ad-hoc analysis (via Aggregate Analysis) loads raw data for a handful of selected races on demand — useful for quick comparisons but slower when many races are involved.
The Performance Database scales to much larger datasets. Data is averaged into fixed-duration phases at the time the collection is created, so subsequent analysis is fast regardless of how many events are included.
Creating a phases collection
Events are not added to the Performance Database automatically — you add them yourself, which lets you exclude practice races or poor-data days.
- In the Data section, select your boat and choose Performance Database from the sidebar.
- Click Phases Database or Manage Phases… to open the collection list.
- Click New Phases Collection.
- Select an event, enter a name (including the event name and conditions makes it easier to find later), and select the races and/or trainings to include.
- Choose a phase duration (see below) and click Create Phases Collection.
Choosing phase duration
Each race is divided into consecutive phases of the chosen duration (maneuvers are excluded). All data within a phase is averaged into a single row.
- 10 seconds — captures more variation within a race; creates larger collections; better for detailed boat-speed or trim analysis.
- 30 seconds — smoother averages; smaller collections; better for season-level trend analysis and polar comparisons.
Use the same phase duration across all collections you intend to compare — mixing durations in the same analysis can produce misleading differences.
Selecting collections for analysis
In the Performance Database view, select one or more phase collections. Most visualization types treat each collection as a separate dataset, making it easy to compare performance between events side by side. See Useful visualization types below for the most relevant views.
Use the Filter button to narrow the data by:
- Point of sail (upwind / downwind / reaching)
- Tack (port / starboard)
- Hoisted sails (if sail changes were recorded)
Useful visualization types
- Targets — compare boat speed and VMG against polar targets across events; the primary view for tracking performance trends over a season.
- Polar Diagram — overlays measured boat speed polar from each phase collection; immediately shows whether speed has improved or regressed at any TWA/TWS combination.
- Scatter Chart — plot any two metrics against each other across events; useful for detailed analysis of speed vs TWA or heel vs boatspeed relationships.
- Bin Table — shows average metrics in TWA × TWS bins per collection; useful for spotting consistent gains or losses in specific wind conditions.
- Statistics / Gain Loss — compare average metrics (VMG%, BSP%, heel) per event collection at a glance.
Managing collections
Collections are not updated automatically when you change a race's course or wind data. After making corrections, delete the affected collection and recreate it.
To delete a collection, open Manage Phases… and remove it from the list.
Tips
- Add events to the database shortly after they happen while the context (conditions, boat setup) is still fresh.
- Exclude races with missing or poor wind data — they will skew polar comparisons.
- Use consistent phase duration across all collections you plan to compare.
Polar Editor
The Njord Polar Editor lets you view and edit polars and targets for your boat.
Open at: app.sailnjord.com/polars/
The editor is free to use and does not require a license or account. When logged in, you can additionally load polars and targets from a boat in your Njord account and save changes back to it.
Polars vs. targets
Polar — describes expected boatspeed as a function of TWS and TWA across the full wind range. Useful for general navigation, passage planning, and performance prediction. Boat designers sometimes provide polar data, but the most accurate polars come from analysing real on-the-water performance — which Njord Analytics helps build over time.
Targets — define the optimal boatspeed, TWA, and heel for upwind and downwind VMG at each wind speed. Targets are the primary reference in windward-leeward racing: they tell helmsman and trimmer what numbers to aim for on each tack and gybe.
Some file formats support both polars and targets; others support only one. The editor shows which data is present in the loaded file.
Using polars and targets in Njord Analytics
When you save a polar or targets file to a boat in your Njord account, it is applied to all subsequent data uploads: polar and target values are inserted into each log file based on the TWS and TWA recorded. This makes target numbers available as channels in all visualizations.
You can manage multiple versions of a polar or targets file in the boat's settings and select which one is active.
Building polars from your own data
The Targets and Polar Diagram views in Njord Analytics each have a button to open the current analysis directly in the Polar Editor — useful for smoothing, adjusting, or merging before saving back to the boat. Treat the output from these views as a starting point rather than a finished polar; some manual editing is usually needed before the data is suitable to use as targets.
What's New in Njord Analytics?
Note: for changes to Njord Player, refer to the version-specific changelog on our website.
- Adds integration between Njord Analytics/Player and the updated SailingPerformance OnboardAssistant Mobile App
- Adds integration between Njord Analytics and AI Assistants to command data analysis in plain language and unlock advanced local analysis capabilities
- Improved performance of creating new Performance Database phases collections
- Ask AI questions about Njord — drop a link into any AI assistant for accurate, up-to-date answers about all Njord products
- In fleet race reports, hides boats that don't cross the start line within 4 minutes after the gun (with an option to show all boats as before)
- Adds option in maneuvers view type to download raw data of each maneuver (selected metrics)
- Now calculates
VMCalong bearing to mark, not along course axis - Added load/save feature and local boat data loading to Njord Web Player making it more versatile
- The scatter chart view type now supports calculated metrics like
VMC,XTE,DistanceToLeaderetc., shows more fine-granular ticks per axis, and adds an option to show reference areas indicating the mean/standard deviation and/or min/max of each data set - Shows course axis bearing and length in Map view along axis line and in Trim Races course elements form
- Adds MAPLINEAR() function
- Adds support for Expedition XML marks files
- Allow race course coordinate input in
dd.ddd,dd mm.mmordd mm ss.sformats - Supports connecting YachtBot/WindBot units to Njord's servers instead of Igtimi's servers
- The scatter chart view type now supports the Color by Tack option when a single time range is highlighted
- The maneuvers view type now supports more than one boat, and comparing maneuvers between boats
- Adds support for loading NMEA 2000 data from Garmin GPSMAP plotters
- Adds support for start line pings and start timer for B&G Hercules log files
- Adds an option to show hoisted sails in the table visualization
- Improves the usability on small mobile devices by allowing the user to open the sidebar like a menu. The old mobile interface is still available for a transition period but is no longer displayed by default.
- Adds a standalone Polar Editor to open polars from any file or from the ORC database, edit targets and polars, and save to multiple polar file formats or directly to a Njord Analytics boat
- Adds the ability to download data from the sail crossover view type to Expedition
- New boat creation wizard makes it easier to create custom design / one-off build boats, have more control over the license assigned to a new boat, and request a new trial license if required
- Adds a filter option to the Table view type
- Improved sample rate of map view in Entire Day view
- Fixes TWD inference with irregularly sampled boat data
- Invert suggested calibration offset for AWA calibration
- Add CSV download to Scatter Chart in Performance Database
- Add Bin Table option to require at least N samples per cell
- Added user settings to configure fractional digits and units per metric
- Added
Leg,Rank,DistanceToLeaderandLogAlongCoursemetrics (available in race with full course);VMCancXTEmetrics are now calculated across an entire race - Supports loading Microsoft Excel files like CSV files
Frequently Asked Questions
How can I add additional data (like heart rate) once a base log file has been uploaded?
To augment data or change any other settings that you made during the initial upload, go to the uploaded file (under Data) then click on the link "Uploaded by ... at ...", then select "Augment uploaded files". You will be able to add (or remove) files from the upload, and finally click "Update Data".
See also: Loading Extra Data
How do I access calibration info (e.g. difference between TWA tack to tack and HDG tack to tack and TWS upwind to downwind, etc)?
The Njord Analytics single boat report contains a calibration report which contains data to help with compass, paddlewheel and wind instrument calibration.
You can create a single boat report via the left hand panel, or via the cogwheel menu ("Edit Reports"). You will find the calibration report at the very bottom of the report main page.
See also: Calibration visualization
Do you have an app that coaches can use for speaking in coach comments?
We offer text input for coach comments via Live Coach Tools — a mobile-optimised web app accessible from any smartphone browser, no download required.
For hands-free use on the water, consider using the dictation feature of your phone to let your speech be transcribed into a text comment.
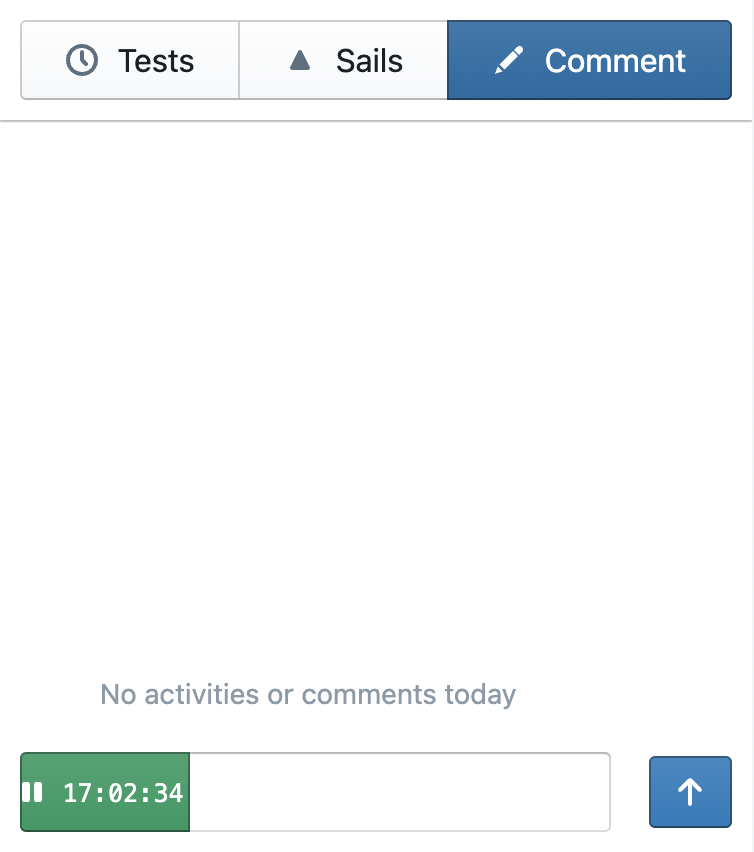
Is it possible to see HDG-COG?
If you want to see a HDG-COG number in all chart types, you can calculate it like so:
- Go to the uploaded data segment; select Process
- Select Add Metric, then Custom Formula
- Enter
HDG-COG=Heading - COG - Press Apply
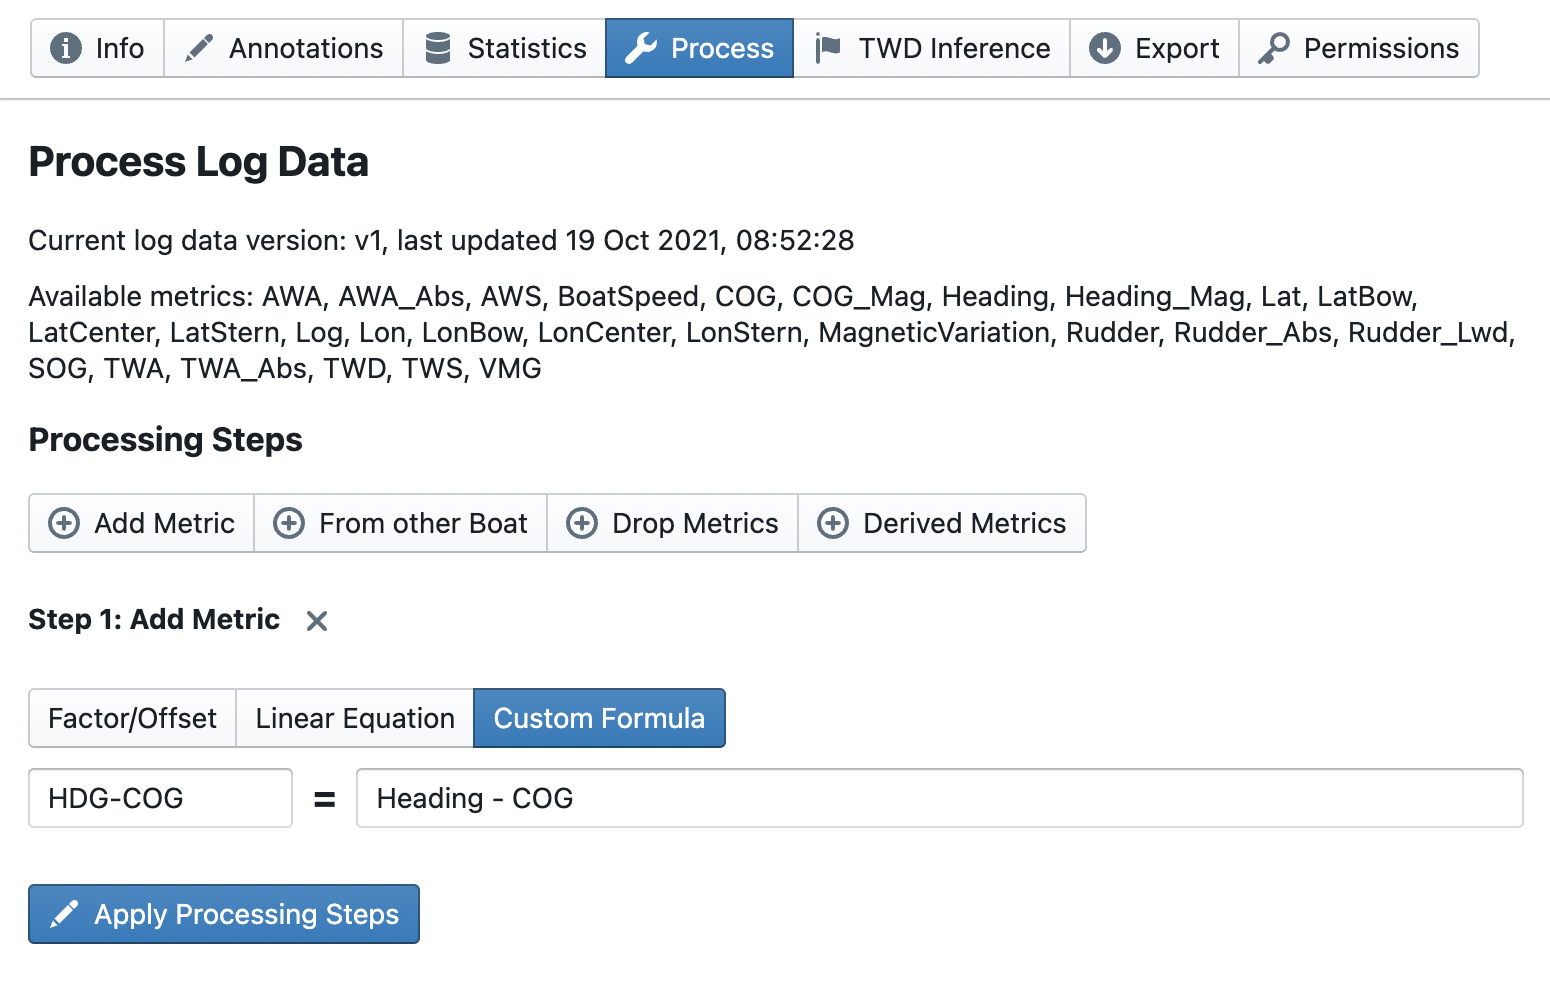
You can also see HDG-COG in the calibration report without performing the steps above.
My Velocitek is mounted on the cockpit side, how can I add 90 degrees to Heading to ensure that it is correct?
You can change Heading data like so:
- Go to the uploaded data segment; select Process
- Select Add Metric, then Custom Formula
- Enter
Heading=Heading + 90 - Press Apply
Heading values will be re-aligned to the 0..360 degrees range after adding 90 degrees.
When setting up the course, is the bearing "from previous element" taken from the starboard end, port end, or middle of the line?
For course elements consisting of two marks (start line, finish line and gates), the center point between the two marks is used to calculate bearing from/to the previous/next course element.
What do I need to do to see an event in the performance database?
Events need to be added to the performance database first. Click on "Phases Database", then "New Phases Collection". You will be asked which races of that event to include (you could exclude practice races, for example, which is why events are not added to the performance database automatically).
Is there any way to output a GPX file of the race data?
Unfortunately, we don't support exporting data to GPX files yet. Supported export formats include CSV and Bravo file formats.
Does Njord Analytics run on iPad?
Njord Analytics runs on any modern browser, including on iPads.
Do you support yardstick / ratings?
No. Any calculations showing the rank of boats, such as in the Fleet Race Report, assume the boats are identical.
Do I need to recreate the report after changing a race's course?
You don't need to make a new report after adjusting the marks. Simply refresh the report page in your browser and the new course will apply.
How can I add sails, and delete old sails?
You can enter your sails, and enter new sails, in Njord Analytics using one of the 3 following methods:
- On the water, use the live sail input page - it's accessible when navigating to your boat and choosing Live Coach Tools
- When selecting any race or training, go to the annotations view, click "Edit Sails Usage", you can enter new sails there
- When using any software to record events on the water, such as Expedition or KND, you can import the events file with your log file and the sail changes from that file will show up
You can rename and remove sails on the Sail Database page.
How do I send a Njord Analytics report to my team?
You need to add people to the boat first, you can do that under Data, then select your boat, then Settings - Permissions and enter the team's email addresses there.
All users that have access to the boat will also be able to access the report by visiting Njord Analytics. You can also have them notified via email with a direct link to the report. To do that, go to the report, and click on the share button next to the title. Select the people you want to send the email to and click Send Notification Emails.
See also: Sharing Boat Access
Is it possible to set a manual TWD for each leg?
You may enter a fixed TWD for the entire day when loading data, or, In Njord Analytics, you can also use the TWD inference feature.
You may also use the INTERPOLATED(SERIES(...)) Formula.
In the comparison with another boat, sometimes the boat that loses meters ("VMG gain") has a higher average VMG - why?
It's a different calculation... "VMG gain" is calculated from the start & end position, using the TWD (average TWD, from both boats) as the reference bearing. "Average VMG" that you see in the table above is taking each boat's TWA & Boatspeed, calculating the instantaneous VMG along the track, and averaging that. In principle the winning boat should have higher average VMG, but that is only true when there are no wind shifts during the tests and both boat's wind instruments are perfectly calibrated. This is rarely the case, that's why such a small deviation is not unexpected. Place higher trust in the "VMG gain" value in this case.
How can I add a boat to an event?
Option 1:
- Go to the event
- From the cogwheel menu (bottom right) select "Edit Event"
- Add the boat to the "Boats" field
- Click "Update"
Option 2
- Go to the boat and select a relevant segment of uploaded data
- Uncheck "Show events with boat only"
- Find the event you want to add the boat to, and click "Add boat to this event"
See also: Comparing Multiple Boats for the broader context of multi-boat analysis.
Why are my maneuvers not being detected?
Work through these checks in order:
- TWA data must be present. Open the Line Chart and add TWA. If it is missing or flat, add wind data first — see Adding Wind Data.
- TWA must cross the trigger angle. A tack requires TWA to cross 0°; a gybe requires TWA to cross 180°. Use the Line Chart to verify TWA moves correctly around the maneuver. If it jumps without crossing (e.g. 30° to 330° without passing through 0°), heading data quality is likely the issue — see below.
- Check the Upwind/Downwind TWA range in boat Settings → Filters. The boat must be sailing within the configured range for the full Exclude Time before and after the maneuver. For foiling boats, the default Downwind range (120–170°) is often too wide — lower it to match your actual downwind TWA.
- Check the data sample rate. Maneuver detection requires at least one sample every 3 seconds (0.33 Hz); 1 Hz or higher is recommended. GPX files from smartwatches often record at only one sample per 5 seconds — configure the device to record at 1 Hz.
Why are maneuvers detected but not analysed?
Enable "Include maneuvers without full analysis" and "Extended data" in the Maneuvers view settings. A "Reason Not Analyzed" column appears explaining why each maneuver was skipped.
Common causes:
- Too close to another maneuver. Analysis requires (Average Time Before + Exclude Time Before) seconds of clean sailing before the maneuver, and likewise after. Back-to-back maneuvers within ~30–40 seconds will often be skipped.
- TWA outside the configured range at the Exclude Time point before or after the maneuver. Widen the range or increase the Exclude Time.
- Boat speed below ~2 knots.
Note: maneuvers cannot be added manually. The fix is always to adjust detection settings or correct the underlying data.
My heading data looks wrong — TWA and maneuver detection are broken
If a self-contained GPS device (Sailmon, Velocitek, Vakaros) is not mounted facing straight forward on the centreline, recorded Heading will be offset and all derived TWA will be wrong.
Option 1 — drop Heading and use COG instead:
- Go to the uploaded data segment → Process → Drop Metrics → select Heading
- Add a Derived Metrics step — Njord will recalculate TWA from TWD and COG
Option 2 — apply a fixed offset for a known mounting angle:
- Go to the uploaded data segment → Process → Add Metric → Custom Formula
- Enter
Heading = Heading + 90(adjust the angle to match your mounting) - Heading values are automatically re-aligned to 0–360°
For Vakaros specifically: if the device is mounted more than ~10° off the centreline, Njord will reject the Heading channel automatically with a "Heading appears invalid" warning and fall back to COG.
How do I recalculate metrics after changing an input (boatspeed, heading, calibration)?
When you want to substitute one channel for another (e.g. use SOG instead of BSP, apply a speed offset, or recalculate TWA after fixing Heading):
- Go to the uploaded data segment → Process
- Select Drop Metrics and drop all derived metrics that depend on the changed input — typically
TWA,TWS,VMG, and any downstream metrics - Apply your correction: Add Metric → Custom Formula (e.g.
BoatSpeed = SOGorBoatSpeed = BoatSpeed + 0.5) - Add a Derived Metrics step to recalculate the dropped metrics from the new base
Note: Applying a formula twice applies it cumulatively. Use Reset to Uploaded Files on the Process tab to start over from the original data.
Why is my TWD inference producing wrong results mid-day?
TWD inference works best with clean straight upwind/downwind sailing, clear tacks and gybes, and consistent wind. When it drifts mid-day:
- Limit the inference time range to start at the first start
- Enter an initial TWD seed value (e.g. the bearing of the first start line)
- For significant mid-day wind shifts, re-run inference separately for each segment with its own wind conditions rather than covering the whole day in one pass
With multiple boats loaded into the same event, inference is more reliable — the algorithm uses combined maneuver geometry across all boats.
If inference fails entirely, try "Weather Data" or a manually entered constant TWD. Defining a full race course (all marks) also helps — leg boundaries from mark roundings are more robust to wind shifts than TWA-based detection.
Polar targets are not appearing or look wrong
- Verify a polar is set as default. Go to boat Settings → Polars and confirm one is marked as active.
- Polars are applied at upload time only. Changing the active polar does not update previously uploaded data. To re-apply: go to the uploaded segment → Process → Reset to Uploaded Files (re-runs processing with the current polar). Or drop the polar-derived metrics and add a Derived Metrics step.
- Enable targets in chart settings. In Scatter or Targets views, the polar targets overlay must be enabled via Chart Settings.
The start report shows incorrect BelowLine values or bow position
- Check your unit preference. BelowLine is displayed in meters or boat lengths per user preference — set at app.sailnjord.com/profile/settings. Two users can see different numbers for the same data.
- Check the GPS antenna location setting on the boat (bow, centre, stern) — applied at upload time. After changing it, re-upload the log file.
- Check for erratic Heading data. Start-line metrics rely on Heading to calculate bow position. If Heading is erratic, drop it via the Process tab — Njord will use COG instead.
Njord Analytics API
Summary
Njord Analytics is based on an API that powers every feature of the web app. It is possible to access this API for the purpose of automating tasks.
All API requests and responses are based on the GraphQL format specification. It is recommended to familiarize yourself with the query language and conventions of GraphQL to use the Njord Analytics API effectively.
You can access an interactive GraphQL API console at https://app.sailnjord.com/admin/graphql which allows you to:
-
Send GraphQL requests (queries and mutations) to the live API without any programming required
-
Browse the API documentation outlining all available queries and mutations and their input and output types (see "Documentation Explorer" symbol in the sidebar)
Note: All requests entered in this console are executed under your currently logged in user account, with all associated privileges and the ability to delete data if not careful (most mutations that delete data are clearly named "delete..." however). To avoid damage, send a simple query like { currentUser { name } } to confirm under which user name you are logged in, and consider using a test account without access to your real data if you want to be on the safe side.
The GraphQL API endpoint to send HTTP requests to when not using the console is https://api.prod.sailnjord.com/graphql
Authentication
Virtually all GraphQL queries and mutations require authorization in the form of an Authorization HTTP header sent with each HTTP request to the GraphQL API endpoint.
API Key
For many automated tasks that are tied to one specific user account, an API key is a suitable form of access control. Create one from your Njord account page at auth.sailnjord.com under API keys: give it a name, choose which permissions it should have per area (boats · events, races & trainings · sailing data · fleet tracking · account — read access is pre-selected, write and delete are off by default), and pick an expiry. The key value (starting with njord_prod_) is shown once at creation — copy it then; it cannot be retrieved later.
Send the key as a bearer token with each GraphQL API request:
Authorization: Bearer njord_prod_...
Keys can be revoked from the same page at any time and stop working within a minute. A key only ever has the access you gave it: the permissions you selected, bounded by your own account's boat access at the time of each request. Grant only the permissions your use case needs — every query and mutation in the schema documents its required permission, and your effective permissions are visible via { principals { permissions } }.
Older self-generated keys (from the currentUser.apiKey query in the console) keep working for now, but that mechanism is deprecated — new integrations should use portal-created keys, which can be revoked and report when they were last used.
OAuth
For advanced use cases where different users require access to the Njord API, integration with Njord's OAuth identity provider is possible. Please contact us if you're interested.
Use Cases
To learn about useful queries and mutations, it can be helpful to inspect the API queries that the Njord Analytics web app performs - simply use the web development tools of your browser of choice, perform the desired task and inspect network requests and responses to the GraphQL API endpoint.
See Query examples for worked recipes covering common analytical tasks and data-upload workflows.
Connecting Njord to Claude, ChatGPT, and other AI assistants
Njord exposes its API as a Model Context Protocol (MCP) server, so AI assistants that support MCP can read your Njord Analytics data on your behalf. You sign in once via your existing Njord account; from then on you can ask the assistant questions in plain language and it pulls the data, runs the analysis, and writes the answer.
This page covers what to connect, how to do it for each supported assistant, and what to expect.
What you can ask
Once connected, the assistant has access to the same data you see in the Analytics web app — events, races, log data segments, instrument time-series, race reports, and the full GraphQL API surface. Questions that work well:
- "What was my average boat speed during race 3 yesterday?"
- "How did my starts compare across the weekend? Which one was the worst, and why?"
- "Plot wind direction across the windward leg of the last race."
- "What was the biggest tack loss I had at the regatta last month?"
- "Compare my upwind VMG to the rest of the fleet across all races on Saturday."
The assistant decides which data to fetch and how to analyse it. Big datasets are downloaded to its sandbox and analysed with Python where possible.
Read-only by default; scoped to your account
The MCP connection is read-only by default. When you grant access, the Njord consent screen shows a permission grid: read access per area (boats · events, races & trainings · sailing data · fleet tracking · account) is pre-selected, while write and delete permissions are off by default. Unless you enable them, the assistant cannot upload data, edit races, delete anything, or change account settings. It only sees boats you already have permission to access in Analytics — granting MCP access does not extend your visibility.
Write access (opt-in). To let your assistant modify data (e.g. add comments, update race times), tick the relevant Write (and, if needed, Delete) boxes on the Njord consent screen when connecting. Your assistant then gains a mutate_graphql tool that can modify data in the areas you granted — and nothing beyond them. To change permissions later, disconnect the assistant and connect it again to go through consent afresh. Most assistants will ask for explicit confirmation before each modification — review carefully and don't auto-approve.
Connection details
Claude, ChatGPT, and most other MCP assistants can register the Njord automatically using the following settings:
| Setting | Value |
|---|---|
| Server URL | https://api.prod.sailnjord.com/mcp |
| OAuth mode (if prompted) | Dynamic Client Registration |
| OAuth scopes (if prompted) | Select all scopes the assistant offers. This doesn't grant anything by itself — the Njord consent screen that follows is where you choose which permissions the assistant actually gets (read is pre-selected; write and delete are off by default). |
When you add the connector, the assistant registers itself with Njord, then redirects you to the Njord sign-in page. Sign in with the email and password you use for app.sailnjord.com, grant access, and you're done.
If your assistant asks for a Client ID (manual fallback)
A few MCP hosts don't support automatic registration and ask you to enter an OAuth Client ID by hand. In that case use:
| Setting | Value |
|---|---|
| OAuth Client ID | njord-mcp |
Everything else — server URL, scopes, and the sign-in step — is identical.
Choosing an assistant
Several MCP-compatible assistants work with Njord. They differ in how they handle large datasets, which affects what kinds of analytical questions land cleanly.
- Claude.ai (web) — works well for analytical work via a Custom Connector.
- Claude Code — works well for analytical work.
- ChatGPT (Plus / Pro / Enterprise) — works well for analytical work.
- Claude Desktop — fine for conversational queries and small analyses. Not currently recommended for data pulls larger than ~250 KB.
If you mostly ask conversational questions ("when was race 3?", "show me the leaderboard"), any of the above works. If you want serious analytical work on a full day or regatta of data, prefer Claude.ai, Claude Code, or ChatGPT. These tools are able to execute custom analysis scripts (written by the AI, e.g. in Python) for much more advanced analytics.
Setup by assistant
The exact UI labels in each app change over time. The pattern is always the same: find the "custom MCP server" or "custom connector" setting, paste the server URL, sign in to Njord when prompted.
Claude (Claude.ai, Claude Desktop, Claude Code)
In Claude.ai or Claude Desktop, open Connectors under the Customize sidebar item, then Add custom connector.
- Server URL:
https://api.prod.sailnjord.com/mcp
That's the only field you need — Claude registers itself automatically, so there's no client ID to enter. Sign in to your Njord account when prompted; the OAuth flow runs the first time the assistant uses the Njord tools.
ChatGPT
In ChatGPT (Plus, Pro, or Enterprise), go to Settings → Apps & Connectors → Advanced settings → Developer mode → ON, then Create app.
- Name: Njord Analytics
- Connection:
https://api.prod.sailnjord.com/mcp - Scopes: select all
- Save, then click Connect to start the sign-in flow
ChatGPT registers itself automatically — there's no Client ID or callback URL to configure. It shows an "unverified" or developer-mode warning during connect — that's normal for any MCP server not yet listed in the OpenAI app directory. We're working on getting Njord into the directory; until then the developer-mode flow is the only path.
Tips for getting better answers
- Give the assistant a date or event reference. "Race 3 yesterday" / "Saturday's racing" / "the J/70 Worlds last month" — the assistant has discovery queries built in for all of these.
- Mention which boat if you have several. "On [boat name], what was..."
- Be specific about what to compare. "Compare my starts across the regatta on below line at gun" works better than "how were my starts?"
- For nuanced analysis ask for the underlying data first. "Pull the CSV for race 3 and show me the wind shift pattern" lets the assistant do real numerical analysis instead of summarising.
- When you don't know the answer to a question yourself, ask the assistant to show you the data it used. Most assistants will surface the GraphQL query they ran, and you can ask follow-up questions in plain language.
Troubleshooting
"My assistant says the file URL is expired but I just got it." The signed file links Njord returns expire after 10 minutes. If the assistant takes a long time between fetching the URL and downloading it, it can hit this. Tell the assistant to "request the data again" — it will call the tool fresh.
"My assistant says it can't reach the URL." This is most common in Claude Desktop. For large data analysis, switch to Claude.ai, Claude Code, or ChatGPT. For small conversational queries, Claude Desktop is fine.
"My assistant returned an answer but the times look wrong." Times in the raw data are in UTC. The assistant should convert to the event's local timezone before showing them, but occasionally it forgets. Ask it: "convert the times to the event's local timezone" and re-run.
For anything else, contact support@sailnjord.com — say which assistant you're using and what you asked.
Query examples
Worked GraphQL queries for common Njord analytical tasks.
Read
- List my boats — boats visible to the authenticated user
- List events for a boat — events a specific boat participates in
- List races with course — races in an event, with start lines, marks, and finish definitions
- Fleet race aggregate — per-boat start, leg, and overall stats across multiple races
- When does a boat have data? — how to find the time windows a boat has uploaded data for, at event / race / segment granularity
Write
- Upload data to a boat — multi-step workflow combining S3 file upload with the
createUploadV2mutation. Requires write access.
Upload data to a boat
This example shows how to upload one or more log files to a boat, to achieve the same result as the Upload Data feature in the web app user interface. Requires write access — the MCP AI connector is read-only by default; write tools (the mutate_graphql tool) are available when you grant the relevant write permissions on the Njord consent screen while connecting (they are off by default — disconnect and reconnect the assistant to change them).
Step 1 - Identify the Boat to Upload Data to
Find the key (unique identifier) of the boat you want to upload data to. That key will look like Boat_xxx-xxx-xxx-xxx. You can can easily get it from the Njord Analytics web URL when navigating to the boat (e.g. on https://app.sailnjord.com/data/Boat_xxx-xxx-xxx-xxx), or you can list boats in a GraphQL API request and request their name and key. To list all boats whose name contains "Test", perform this query:
{
  listBoats(filter: { nameMatches: "Test" }) {
    boat {
      key
      name
    }
  }
}
You will use the boat's key in the following requests.
Step 2 - Upload Data
Any data files you want to load need to be uploaded to an AWS S3 bucket, as direct file uploads to the GraphQL API are not supported. You can use your own S3 bucket if you like (must be world readable), or use an Njord-owned bucket. The latter option is recommended and is described here.
Perform the following query (insert the chosen boat key) to get bucket details and AWS credentials to access it. Note the prefix, all files you upload must be stored under this prefix as only PutObject requests under this prefix are permitted with the provided credentials.
{
  getS3UploadDestination(type: Data, boat: "Boat_...") {
    awsRegion
    endpoint
    bucketName
    prefix
    accessKeyId
    secretAccessKey
    sessionToken
    expiration
  }
}
Upload all files to the S3 bucket using an AWS client of your choice and note each file's full Key.
Step 3 - Generate Processing Instructions and Start File Processing
In the most basic form, when you want to upload only one file without any custom options, the request would look like this (insert the chosen boat key and uploaded file key):
mutation {
  createUploadV2(
    input: {
      boatKey: "Boat_..."
      processInput: {
        source: {
          files: [
            {
              s3Bucket: "user-uploads.prod.sailnjord.com"
              s3Key: "<prefix>/yourfile.csv"
            }
          ]
        }
        steps: [{ addDerivedColumns: { add: true } }]
        insertBoatProcessSteps: true
        insertDefaultBoatPolar: true
      }
    }
  ) {
    key
    state
  }
}
Note the key of the upload object, which allows you to confirm the progress and result of your upload in the next step.
Many options exist to manipulate uploaded files and combine them in different ways, which can be specificed through processing instructions (input field processInput). To understand these options, is best to perform the equivalent upload using the Njord Analytics web app, and inspect the processInput in the request sent to the API.
Step 4 - Verify Upload Success or Failure
To check the status of your upload, perform the following request and repeat until state becomes Completed or Failed. This step is optional and is for your information only, processing will normally complete in a few seconds up to a minute without further action. Uploaded data will show up under the selected boat in the Njord Analytics web app.
{
  upload(key: "Upload_...") {
    key
    state
    boat {
      name
    }
    files {
      originalFileName
    }
    processedSegments {
      key
      startTime
      endTime
    }
    errorMessage
    logMessages
  }
}
To more easily inspect the result of your upload, you may also visit the following URL (insert your boat and upload keys): https://app.sailnjord.com/data/Boat_.../upload/Upload_...
List boats visible to the authenticated user
Returns boats the user has read access to. Use this as the entry point for any analysis scoped to specific boats — the user typically needs to pick a boat before drilling into events, races, or performance data.
Query (recommended: listBoats)
listBoats is the recommended entry point — cursor-paginated, sortable, with a rich filter input:
query ListMyBoats($limit: Int = 50, $after: ID) {
  listBoats(limit: $limit, after: $after, sort: Name) {
    cursor
    boat {
      key
      name
      boatClass {
        key
        name
      }
      liveDataStatus {
        isOnline
        lastSourceTimestamp
      }
    }
  }
}
For more boats, pass the last item's cursor value as the next request's after.
Common filters
listBoats(filter: ListBoatFilterInput) supports:
nameMatches: "..."— case-insensitive substring on boat nameminimumRole: Manager— narrows to boats the user can editboatClass: ID— filter to one boat classdataBetween: { start, end }— boats with logged data overlapping the range (e.g. "what was sailing last weekend?")hasLiveDataAfter: Date— boats that streamed live data after a given timeevent: ID— boats in a specific event
sort accepts Key, Name, or Created.
Legacy alternative: allBoats
allBoats(...) is kept for back-compat — flat list, no pagination, fewer filters. Reach for it only if you specifically need the unpaginated array shape; prefer listBoats for new work.
query AllBoatsLegacy {
  allBoats(onlyManagerBoats: false) {
    key
    name
  }
}
Notes
liveDataStatus.isOnlinereflects whether the boat is currently streaming, not whether it has streamed recently. UselastSourceTimestampfor the most recent ingestion time.- Boats can belong to multiple events; this query returns the boats themselves, not their event memberships.
List events for a specific boat
Given a boat key, lists the events the boat is associated with — typically a regatta, training camp, or season block. Use it to surface a date-and-name picker before drilling into race-level data.
Query (recommended: bounded by date range)
boat.eventsBetween is the preferred entry point — pass a date range that matches the user's question. The unbounded boat.events exists too but can return many hundreds of entries on busy accounts, so prefer the bounded form even for wide ranges (e.g. a whole season):
query EventsForBoat($boatKey: ID!, $from: Date!, $to: Date!) {
  boat(key: $boatKey) {
    key
    name
    eventsBetween(startTime: $from, endTime: $to) {
      key
      name
      startTime
      endTime
      timezone
    }
  }
}
Variables:
{ "boatKey": "Boat_…", "from": "2026-01-01T00:00:00Z", "to": "2026-12-31T23:59:59Z" }
Alternative — across all visible boats by time range
For "show me events that overlap last month" regardless of which boat:
query EventsBetween($startTime: Date!, $endTime: Date!) {
  eventsBetween(startTime: $startTime, endTime: $endTime) {
    key
    name
    timezone
    boats { key name }
  }
}
Filter client-side by boat membership if you want a boat-scoped result.
Alternative — by calendar day
For "did anything happen on the 14th?", eventsOnDate handles the event's own timezone for you:
query EventsOnDate($date: String!) {
  eventsOnDate(date: $date) { key name timezone startTime endTime }
}
Date format is YYYY-MM-DD.
Notes
startTime/endTimeare full ISO 8601 timestamps; convert to the event'stimezone(IANA name) before rendering for the user.- Some events have very loose date bounds (e.g. season-long training); a narrow time range may exclude them. Widening the
eventsBetweenwindow is the right adjustment, not falling back to the unboundedboat.events.
List races in an event, including course definition and timing
Given an event key, lists every race with timing and course definition.
The course is the structure that makes leg-based analysis possible: without start line, marks, and finish defined, only single-leg metrics (overall distance, average speed) are meaningful. With a course defined, leg boundaries are derived from mark roundings rather than wind shifts, which is more robust when the wind shifts mid-race.
Query
query ListRacesForEvent($eventKey: ID!) {
  event(key: $eventKey) {
    key
    name
    races {
      key
      name
      startTime
      endTime
      course {
        elements {
          type
          name
          coord1 { lat lon }
          coord2 { lat lon }
        }
      }
    }
  }
}
Variables:
{ "eventKey": "Event_…" }
Filtering for analysable races
Many races don't have a course defined (training, casual practice). Filter client-side by course != null if the downstream analysis requires leg structure:
const analysable = data.event.races.filter(r => r.course != null);
Course element types
The elements array describes the race course in order. Common type values:
StartLine— paired coordinates (port pin, committee boat);coord1/coord2are the two ends.Mark— single point (coord1);coord2is null. Roundings detected from boat track proximity.Gate— paired coordinates for a leeward or windward gate.FinishLine— paired coordinates, same shape as StartLine.
Notes
startTimeis the race start gun;endTimeis the time the last analysed boat crossed the finish (not the published race-committee finish).- For races where the start line is reused as a gate (multi-lap course), the auto-detected
endTimemay be the first lap — extend manually in the Analytics UI before relying on it for full-race aggregates.
Fleet race aggregate — start, leg, and race stats for one race
Returns the start-line, per-leg, and full-race stats that power the printable Fleet Race report and the fleetRaceInfo view in the web UI. Single race per call; for cross-race comparisons, list event(key).races and call this for each.
Preconditions: the race must have a proper course defined (at minimum start line + finish line). Per-leg fields require all marks to be set. fleetRaceInfo errors at the resolver if the course is incomplete.
boatKeys is optional — omit to get every boat in the event; pass to restrict.
Query
query FleetRaceView($raceKey: ID!, $boatKeys: [ID!]) {
  race(key: $raceKey) {
    key
    name
    fleetRaceInfo(boatKeys: $boatKeys) {
      boats { key name }
      startData {
        boat { key }
        lineCross
        lineCrossRank
        belowLineGun
        belowLineGunRank
        sogGun
        sogGunRank
        sogLine
        sogLineRank
        lineLength
        crossLineDistToStbdRelative
        sogGunMinus5Relative
        sogGunPlus5Relative
        distanceCrossToBiasPointRelative
        lastManeuverSec
        lastManeuverTimeToKill
        laneXteMax
      }
      legsData {
        legNumber
        type
        boats { ...legBoatStats }
      }
      raceData {
        boats { ...legBoatStats }
      }
    }
  }
}

fragment legBoatStats on FleetRaceLegBoatData {
  boat { key }
  distance
  distanceRank
  duration
  durationRank
  avgTws
  avgTwd
  avgSogKts
  avgSogKtsRank
  maxSogKts
  maxSogKtsRank
  minSogKts
  minSogKtsRank
  avgVmcKts
  avgVmcKtsRank
  maxVmcKts
  maxVmcKtsRank
  minVmcKts
  minVmcKtsRank
  legStartTime
  legStartTimeRank
  legEndTime
  legEndTimeRank
  timeToLeader
  foilingTimePerc
  foilingTimePercRank
  tacks
  tacksRank
  gybes
  gybesRank
  maneuvers
  maneuversRank
  liftInfos {
    referenceType
    referenceTwdAvg
    liftAvg
    liftAvgRelative
    liftMin
    liftMinTime
    liftMax
    liftMaxTime
    liftedRatio
  }
}
Variables:
{ "raceKey": "Race_…", "boatKeys": null }
Aggregating across multiple races
fleetRaceInfo is per-race. To cover a regatta, fetch the race list first and call this query per race in parallel:
query EventRaces($eventKey: ID!) { event(key: $eventKey) { races { key } } }
Field meanings
Response top-level
boats— flat list of participating boats (boatKeysif you passed it, otherwise every boat in the event).startData— per-boat start-line analysis. One entry per boat.legsData— per-leg breakdown. One entry per leg of the course.raceData.boats— per-boat aggregates across the whole race, in the sameFleetRaceLegBoatDatashape as a single leg.
Every quantitative field has a paired …Rank (1 = best in fleet for that metric).
startData per boat
Linear / timing:
lineCross(s) — seconds after the gun the bow crossed the line. Negative = early (OCS).belowLineGun(m) — bow distance below the line at the gun. Negative = over.sogGun,sogLine(knots) — SOG at the gun and at the moment of line cross.sogGunMinus5Relative,sogGunPlus5Relative— SOG 5 s before / after the gun, expressed as a ratio ofsogGun(so 1.0 = same as gun).
Line position:
lineLength(m) — start-line length. Race-level constant, repeated per boat.crossLineDistToStbdRelative— where on the line the boat crossed, normalised. 0 = stbd / RC end, 1 = port / pin end.distanceCrossToBiasPointRelative— distance from cross point to the favoured end (relative to line length). 0 = at bias point.
Pre-start handling:
lastManeuverSec(s) — seconds before the gun of the last tack/gybe.lastManeuverTimeToKill(s) — TTK at that moment (or at gun−60 s, whichever is later).laneXteMax(m) — max XTE during the final lane (last maneuver or gun−60 s, whichever is later).
legsData entries
legNumber— 1-based leg index.type—PointOfSailenum:Upwind/Downwind/Reach.boats— per-boat stats for this leg (FleetRaceLegBoatData).
FleetRaceLegBoatData (used by legsData[].boats and raceData.boats)
distance/duration(m / s) — sailed, not theoretical.avgTws,avgTwd— averages over the leg.avgSogKts,minSogKts,maxSogKts(knots) — SOG distribution over the leg.avgVmcKts,minVmcKts,maxVmcKts(knots) — VMC (velocity made on course toward next mark).legStartTime,legEndTime(ISO strings) — when this boat entered / exited the leg. ForraceData.boats,legEndTimeis the boat's finish time.timeToLeader(s) — seconds behind the boat leading at leg end.foilingTimePerc(0..1) — fraction of leg time foiling. Needs aFoilingmetric in the data.tacks,gybes,maneuvers— counts of each over the leg.liftInfos— wind-shift analysis vs a reference TWD.referenceTypetells you what the reference is;liftAvg/liftMin/liftMaxare degrees;liftedRatio(0..1) is the fraction of leg time on a lifted vs. headed shift.
Notes
- All boats appear in
boats[]even if they didn't sail. MissingstartData/legsDataentries mean that boat's data wasn't available for that race or leg. - Single-boat input is valid; rank fields trivially come back as 1.
- For "rank delta between leg 1 and finish" (common ask), use the per-boat
legsData[0].boats[i].legEndTimeRankvsraceData.boats[i].legEndTimeRank. - For "where on the line was the bias?" — sort the fleet by
distanceCrossToBiasPointRelativeand look at the cluster.
When does a boat have data?
A common starting question for any analysis is "what time windows is there data for this boat?". Njord exposes this at three levels of granularity, and the right one depends on the question being asked. This page covers all three, with GraphQL examples for each.
The three levels:
- Event-level — calendar periods marked as a regatta, training camp, or season block. Good for "what events did this boat participate in?".
- Race-level — individual races with precise gun and finish times. Good for "the third race of Sunday".
- Segment-level — the raw upload reality. Each
LogDataSegmentis one chunk of uploaded log data (typically one sailing day from one device). Good for "all data we have for this boat", including deliveries, practice days, or anything not wrapped in an event.
Event-level
For events a boat participated in within a specific date range — typically the right starting point because you usually have at least a rough sense of "when":
query EventsForBoat($boatKey: ID!, $from: Date!, $to: Date!) {
  boat(key: $boatKey) {
    eventsBetween(startTime: $from, endTime: $to) {
      key
      name
      startTime
      endTime
      timezone
    }
  }
}
Pass an explicit startTime / endTime. boat.events exists but is unbounded — on busy accounts it can return many hundreds of entries — so prefer eventsBetween with a range that matches the question, even if that range is wide (e.g. the current season).
For the most recently started (or about to start) event the user has access to:
query LatestEvent {
  latestEvent { key name startTime endTime timezone }
}
For a specific calendar day — handles the event's own timezone for you, which eventsBetween does not:
query EventsOnDate($date: String!) {
  eventsOnDate(date: $date) { key name timezone }
}
Date format is YYYY-MM-DD.
For events matching a name (e.g. a regatta the user named) regardless of date:
query FindEventByName($name: String!) {
  listEvents(filter: { nameMatches: $name }) {
    cursor
    event { key name startTime endTime timezone }
  }
}
listEvents is paginated and supports name + role filters but does NOT filter by time — use boat.eventsBetween or eventsOnDate for date-based queries.
Race-level
Once you have an event, drill into its races:
query RacesForEvent($eventKey: ID!) {
  event(key: $eventKey) {
    timezone
    races {
      key
      name
      startTime
      endTime
      raceType
    }
  }
}
A race's startTime is the gun time and endTime is the finish (extended slightly so the final leg is fully covered). This is the canonical reference for "during race 3 of the regatta" — the boundaries match what you see in the Analytics race sidebar.
Races optionally have a defined course (start line + marks + finish). Without a course, only the time window is reliable; per-leg fields elsewhere in the API require a complete course definition. Use the list-races-with-course example to filter to races that have one.
Segment-level
A LogDataSegment is one chunk of uploaded log data and exists regardless of whether the user has organised the data into events. Useful when you want everything Njord has for a boat — deliveries, practice days, race weeks, the lot.
For segments in a date range you have in mind:
query SegmentsForBoatBetween($boatKey: ID!, $from: Date!, $to: Date!) {
  boat(key: $boatKey) {
    logDataSegmentsBetween(startTime: $from, endTime: $to) {
      key
      startTime
      endTime
      timezone
      metrics
      records
    }
  }
}
For "recent N segments" without a specific date in mind, paginate from the newest:
query RecentSegments($boatKey: ID!, $limit: Int!) {
  boat(key: $boatKey) {
    listLogDataSegments(limit: $limit, reverse: true) {
      cursor
      logDataSegment {
        key
        startTime
        endTime
        timezone
        metrics
        records
      }
    }
  }
}
reverse: true returns newest first (also the default). Prefer listLogDataSegments or logDataSegmentsBetween over the unbounded boat.logDataSegments, which can return very large lists on active boats.
Other useful variants on Boat:
boat.logDataSegmentsInRace(raceKey)— segments that overlap a specific race
Or starting from a date instead of a boat:
query SegmentsOnDate($date: String!) {
  logDataSegmentsOnDate(date: $date) {
    key
    startTime
    endTime
    timezone
  }
}
Choosing the right level
- "What regattas did we sail this year?" → event-level
- "The third race of Sunday" or any specific race → race-level (after locating the event)
- "All data we have for this boat", "that delivery passage", or anything outside event structure → segment-level
For analytical work the typical path is two or three hops: boat → events → races → drill into one race. From a race's startTime and endTime you have a precise window to pull instrument data for. For exploratory questions where you're not sure what's there, start at segment-level and work upward.
Notes
- All times in the API are stored as ISO 8601 UTC. Events and races carry a
timezone(IANA name likeEurope/Stockholm). Convert to local time before showing to users — a race in Palma at 11:42 local should not appear as 09:42Z. boat.eventsreturns events the boat is associated with; a boat can be added to or removed from events without affecting the underlying data.- Segment boundaries are usually one sailing day; continuous multi-day offshore recordings can be longer.
Live Data API
The Live Data API can be used to receive live streamed boat data and is different from the GraphQL API.
Protocol
The Live Data API uses the WebSocket protocol exclusively. All messages (requests and responses) are send as JSON encoded objects.
Authentication
The Live Data API uses the same API tokens as the GraphQL API. For instructions on how to retrieve an API key, see Authentication. A valid API key must be used when subscribing to data (see below), and will only allow subscribing to data of boats that the user owning the API key has permissions for.
Endpoints
Njord operates multiple live data endpoints around the globe to ensure low latency between the boat and the live data endpoint. At the time of writing this, there are 3 endpoints, in Frankfurt (Germany), Northern Virginia (USA) and Sydney (Australia).
When set up correctly, boats will send live data to the nearest endpoint automatically. In order to receive live data via the API, you need to connect to the appropriate endpoint. There are two strategies that you can use.
Retrieve a Boat's Endpoint
To retrieve the live data endpoint WebSocket URL for a specific boat, access the liveDataStatus.WebSocketUrl2 field of that boat in any GraphQL query. For example, the following GraphQL query will return all boats that you have access to that have sent live data at some point, and their WebSocket URLs.
query {
  listBoats(filter: { hasLiveDataAfter: "2020-01-01T00:00Z" }) {
    boat {
      key
      name
      liveDataStatus {
        webSocketUrl2
      }
    }
  }
}
The response will look like:
{
  "data": {
    "listBoats": [
      {
        "boat": {
          "key": "Boat_abc",
          "name": "Live Boat",
          "liveDataStatus": {
            "websocketUrl2": "wss://live-eu-central-1.prod.sailnjord.com:5002/"
          }
        }
      }
    ]
  }
}
Connect to All Endpoints
You can also create separate connections to all live data endpoints at the same time. The advantage of this approach is that you will still receive data when a boat suddenly starts sending data to a different live data endpoint than the one you originally connected to. This can happen if the boat moves physically, or if there are changes in the boat's internet connection. You will need to subscribe to the desired boats on each connection / endpoint separately.
To retrieve all live data endpoints and their WebSocket URLs, use the following GraphQL query:
query {
  streamingGateways(onlyOnline: true) {
    webSocketUrl2
  }
}
The response will look like:
{
  "data": {
    "streamingGateways": [
      {
        "websocketUrl2": "wss://live-ap-southeast-2.prod.sailnjord.com:5002/"
      },
      {
        "websocketUrl2": "wss://live-eu-central-1.prod.sailnjord.com:5002/"
      },
      {
        "websocketUrl2": "wss://live-us-east-1.prod.sailnjord.com:5002/"
      }
    ]
  }
}
WebSocket URLs for each endpoint are designed to be stable, and we add or remove endpoints very infrequently.
Heartbeat - Ping/Pong
After connecting to the WebSocket URL, it is the client's responsibility to send a ping message once at least every 15 minutes. A shorter interval like 1 minute is recommended. If the server doesn't receive a ping message within that time interval, it may terminate the WebSocket connection.
A ping message is a JSON-formatted object like the following, where ping and requestId values are arbitrarily chosen by the client.
{ "requestId": "uuid-xxx-yyy-zzz", "ping": 1 }
The server will always respond with a pong message immediately, repeating both values. If you don't receive a pong message, consider reconnecting.
{ "requestId": "uuid-xxx-yyy-zzz", "pong": 1 }
Receiving Live Data
Send a subscription request, a JSON-formatted object like the following. The requestId value is optional and is arbitrarily chosen by the client, for authorization, insert a valid API token.
You can subscribe to:
- one or more boats using the
boatKeysfield (array of boat keys), and/or - one or more wind stations using the
windStationKeysfield (array of wind station keys), and/or - one or more data sources using the
dataSourceKeysfield (array of data source keys)
{
  "requestId": "uuid-xxx-yyy-zzz",
  "subscriptionRequest": {
    "authorization": "...",
    "boatKeys": ["Boat_123", "Boat_456"]
  }
}
If the subscription was successful, the server will respond with:
{
  "requestId": "uuid-xxx-yyy-zzz",
  "subscriptionResponse": {
    "boatKeys": ["Boat_123", "Boat_456"],
    "subscribed": true
  }
}
Else, the response will look like this:
{
  "requestId": "uuid-xxx-yyy-zzz",
  "subscriptionResponse": {
    "boatKeys": ["Boat_123", "Boat_456"],
    "subscribed": false,
    "error": "Permission denied"
  }
}
Whenever live data is received from the boat, and until unsubscribed, the server will respond with a data message like this (sourceTimestamp is the time in UNIX epoch/milliseconds at which the the data originated at the source, and gatewayTimestamp is the timestamp when it was received by the Njord live data endpoint):
{
  "boatKey": "Boat_123",
  "sourceTimestamp": 1738866164000,
  "gatewayTimestamp": 1738866164100,
  "records": {
    "BoatSpeed": 8.2,
    "Heading": 270.0
  }
}
To unsubscribe, send a request like:
{
  "requestId": "uuid-xxx-yyy-zzz",
  "unsubscribeRequest": {
    "boatKeys": ["Boat_123", "Boat_456"]
  }
}
Sending Live Data
Sending live data to a live data endpoint does not use the Live Data API, as application-specific protocols are being used (NMEA 0183 and Expedition format via UDP, Igtimi data via their own protocol).
If you are interested in sending live data using a WebSocket connection in addition to receiving it via a WebSocket connection as described above, contact us.
Overview
Njord Player combines boat data and video for visual team debriefs. Everything aligns to the same timeline automatically — seek to any moment and see data and footage in sync.
Desktop app (Windows/Mac) — download from sailnjord.com/player. Supports multi-window presentation across multiple screens.
Web Player — runs in the browser, no installation needed. Works on iPad and Android tablets. See Njord Web Player.
Typical first session
- Load boat data — either download directly from your Njord Analytics account, or load a log file from disk.
- Load media — drag in video, photo, or audio files. Player aligns them to the data timeline automatically using embedded timestamps.
- Review — use the timeline at the bottom to navigate. Click any moment to jump there across all open windows.
- Save — Player saves to a
.sail2document file. Reopen it any time to continue.
Tip: if you use Njord Analytics, load data from there (step 1) rather than from a raw log file — race structure and comments carry over automatically.
Loading Data into Njord Player via Njord Analytics
This method is recommended when you are using Njord Analytics together with Njord Player. We recommend to load the relevant boat data in Njord Analytics first, as it is then straightforward to use the same data in Njord Player. In some cases support for new data file formats is also available in Njord Analytics first, requiring use of this method.
Step 1
Start with a new Njord Player file
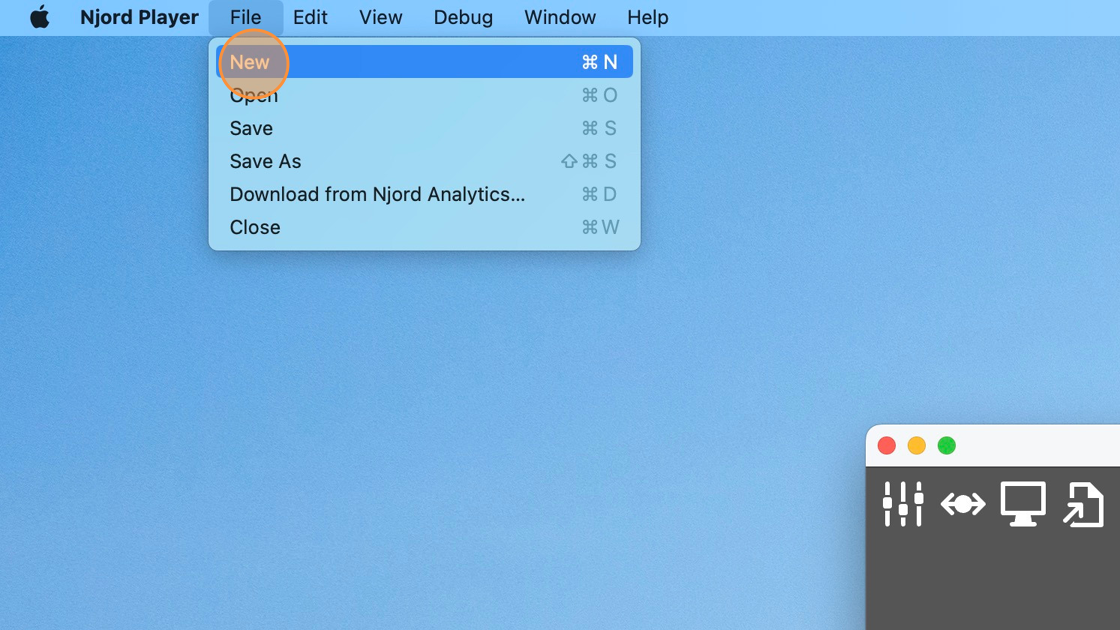
Step 2
Click "File" / "Download from Njord Analytics…"
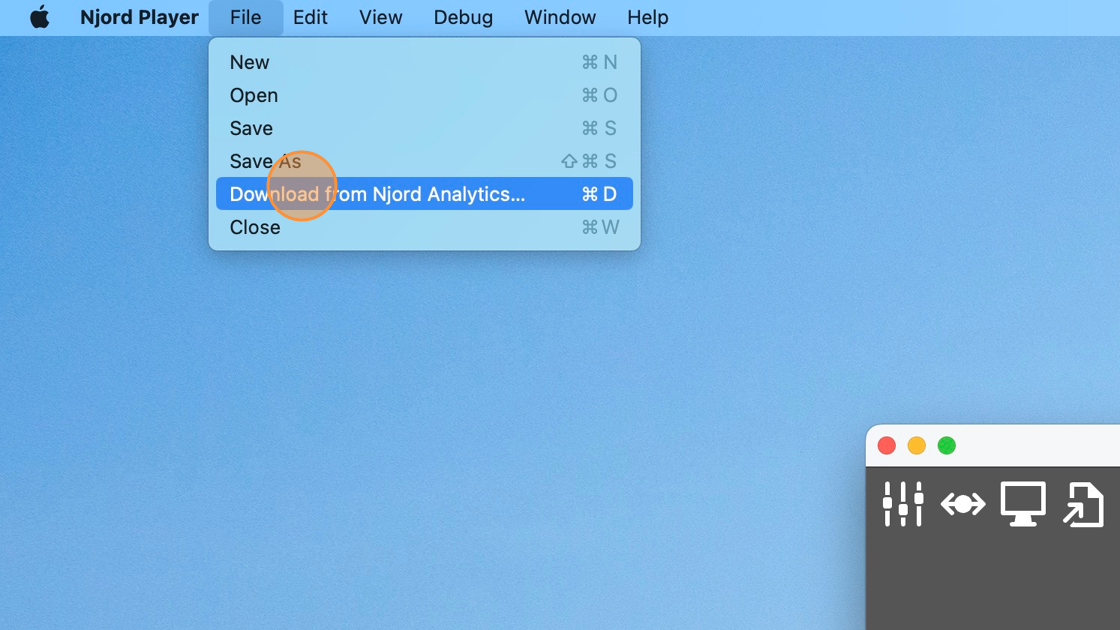
Step 3
Select the date to download data for
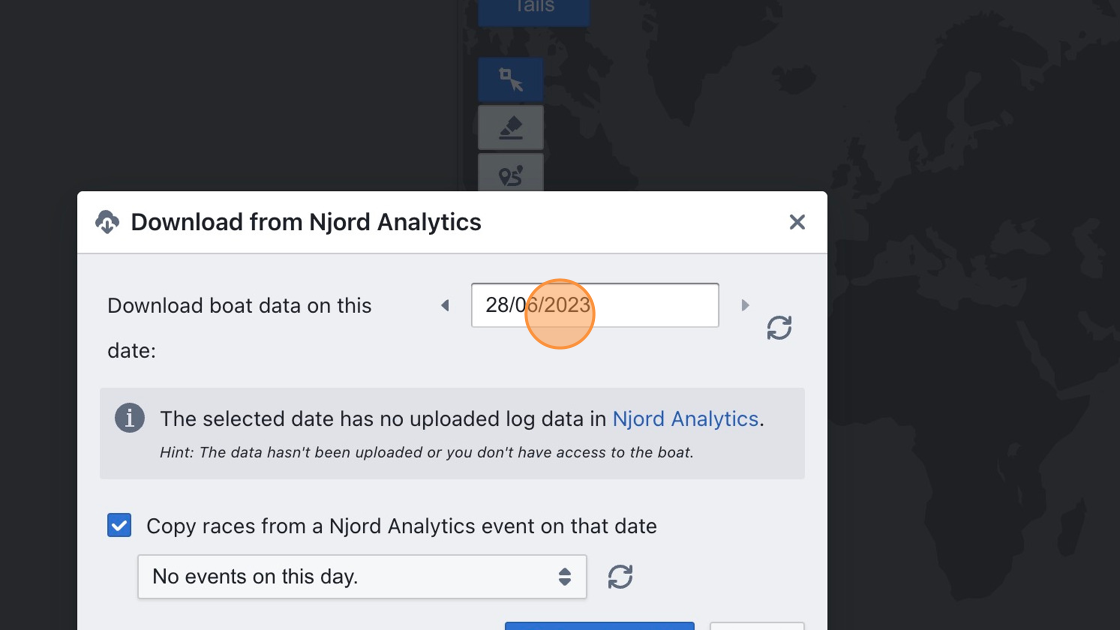
Step 4
Click here
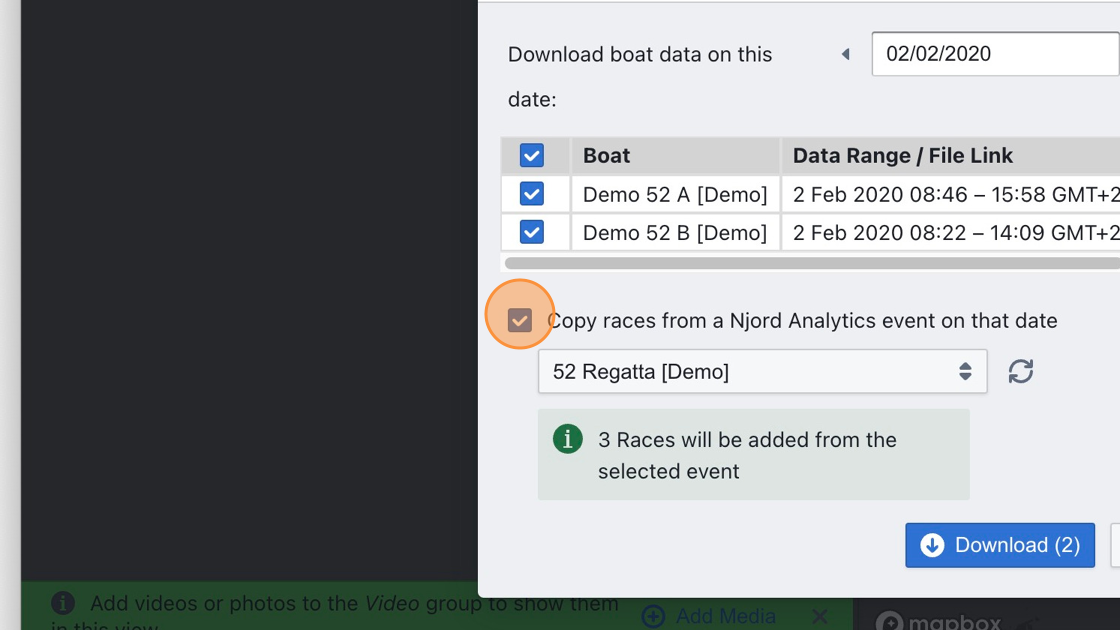
Step 5
Click "Download" and wait for the selected data to be downloaded
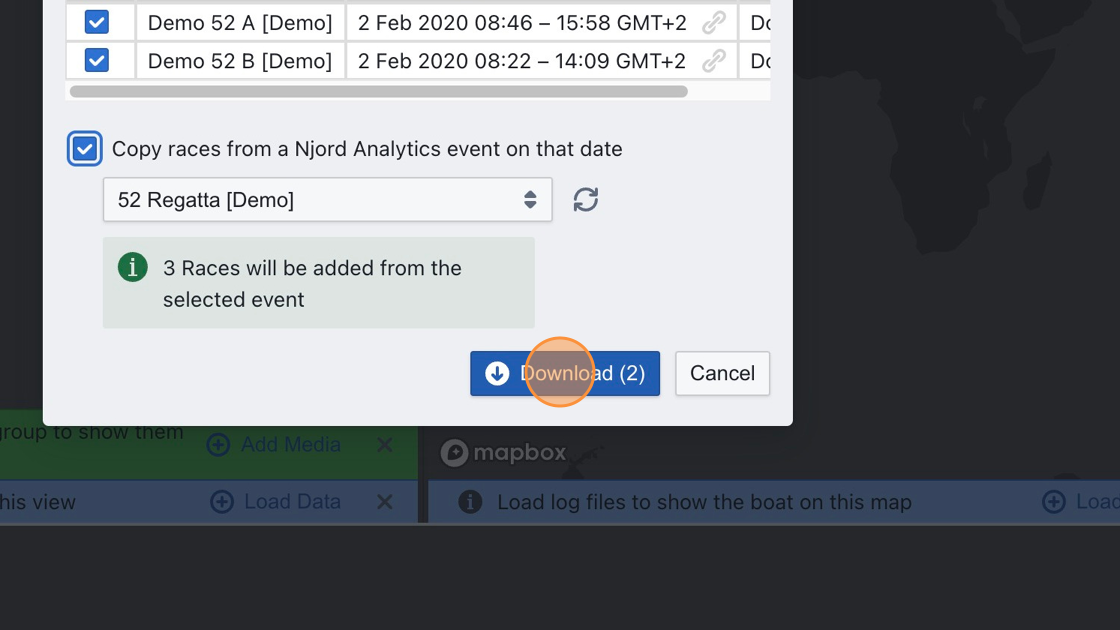
Step 6
Navigate the time track which displays all downloaded races, and click in the time track to seek to a time in a race
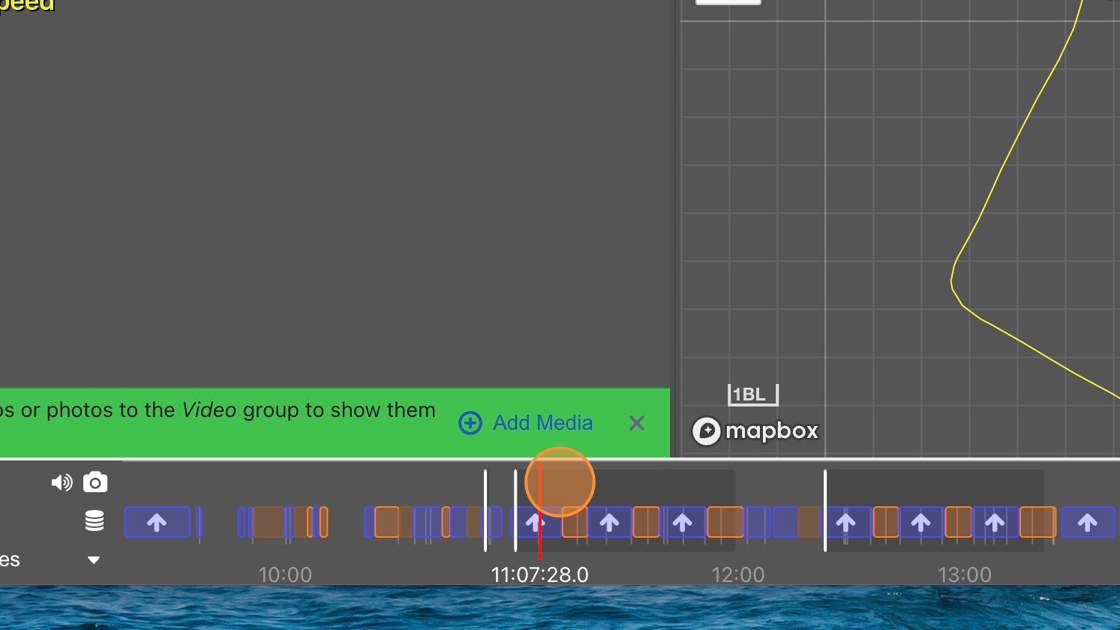
Loading Data into Njord Player Directly
This method is recommended when you are not using Njord Analytics, or when your computer does not have an internet connection when you load data.
Step 1
Start with a new Njord Player file
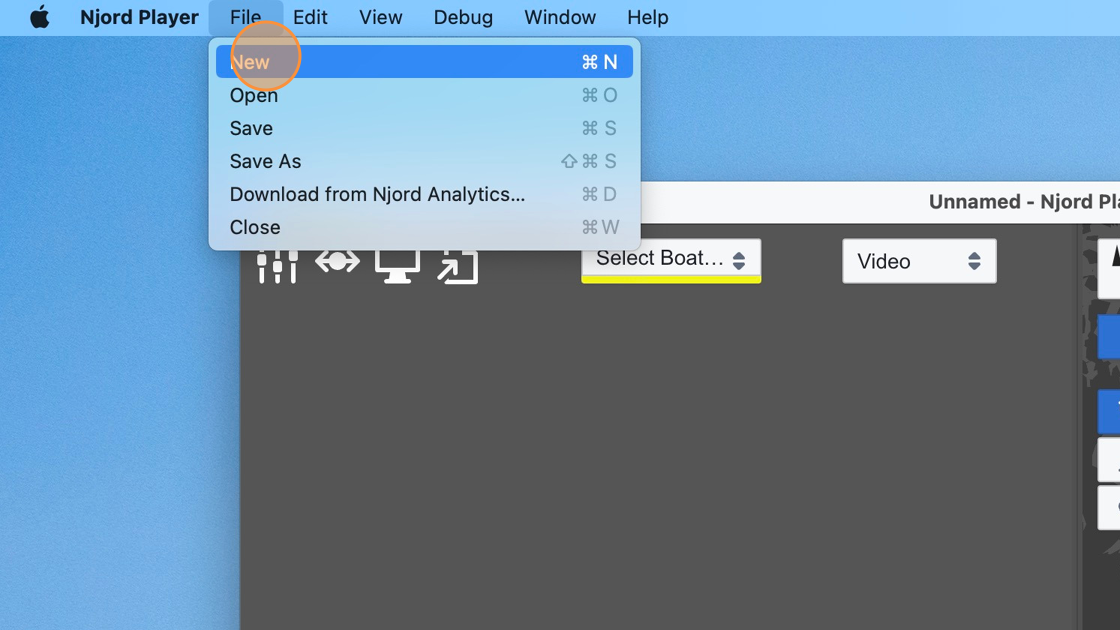
Step 2
Click "Load Data"
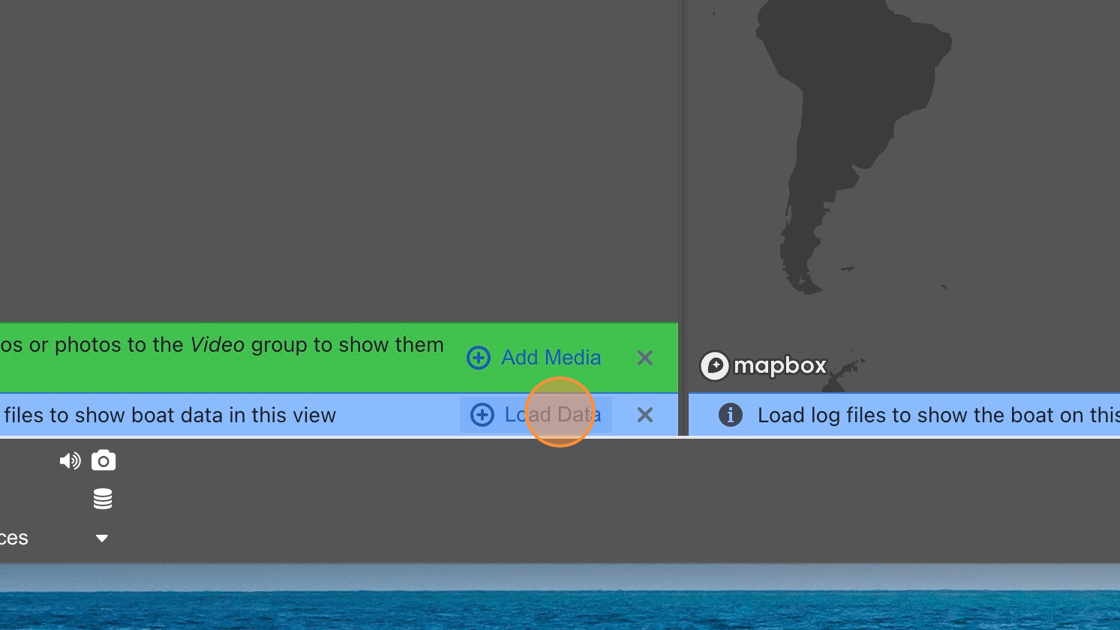
Step 3
Select the boat you want to load data for (you may create a boat if you haven't done so)
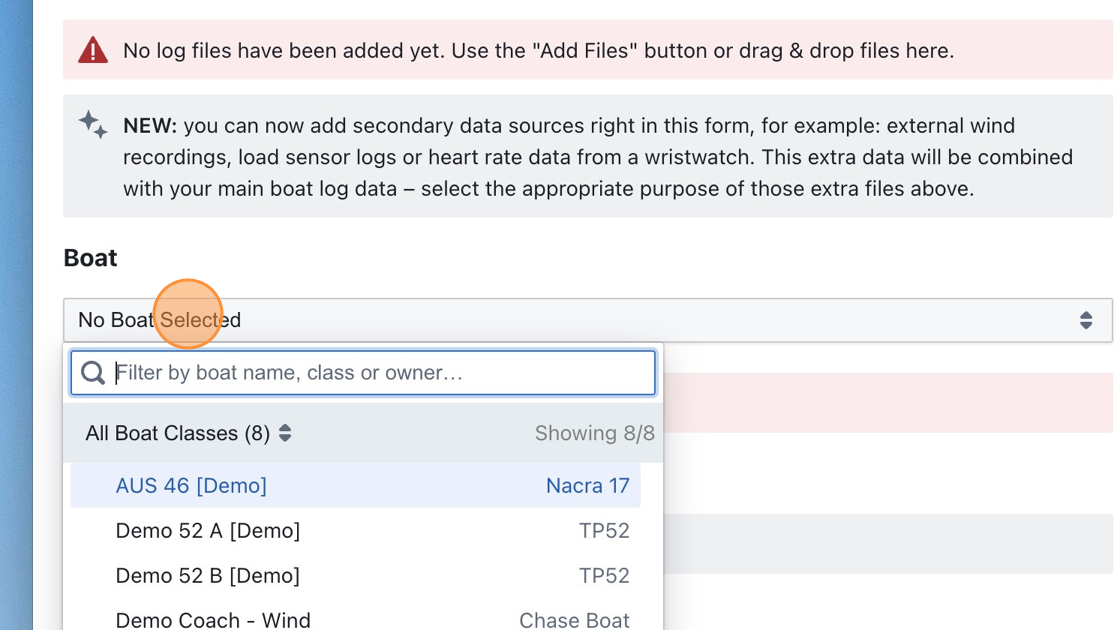
Step 4
Click "Add Files" and select the log file to load
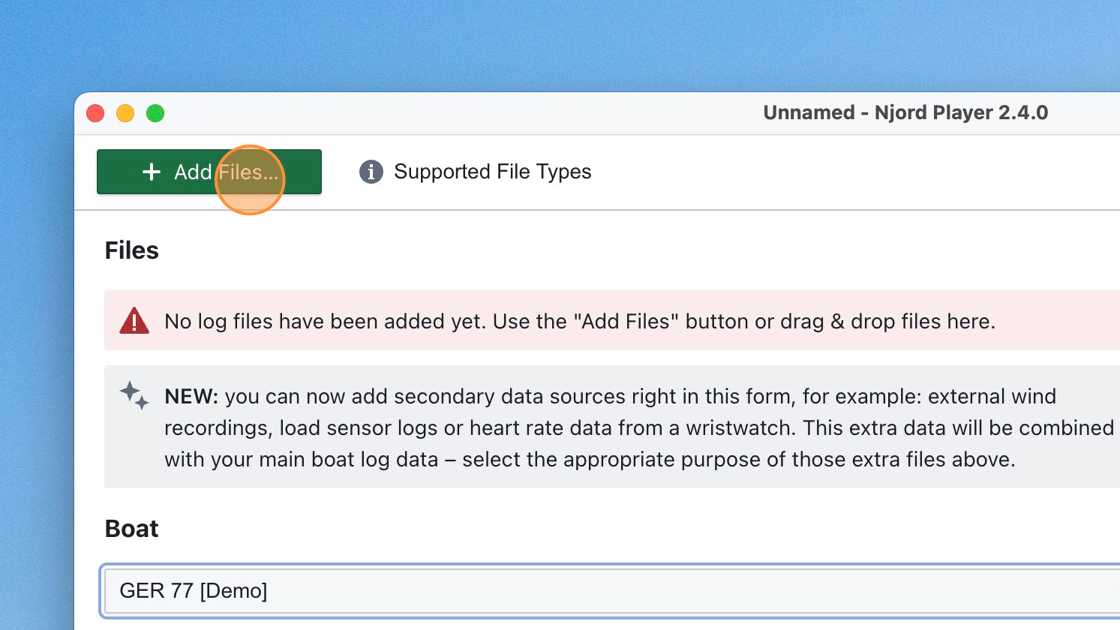
Tip: Learn more about supported data sources at https://www.sailnjord.com/data-sources/
Step 5
Click "Use Data"
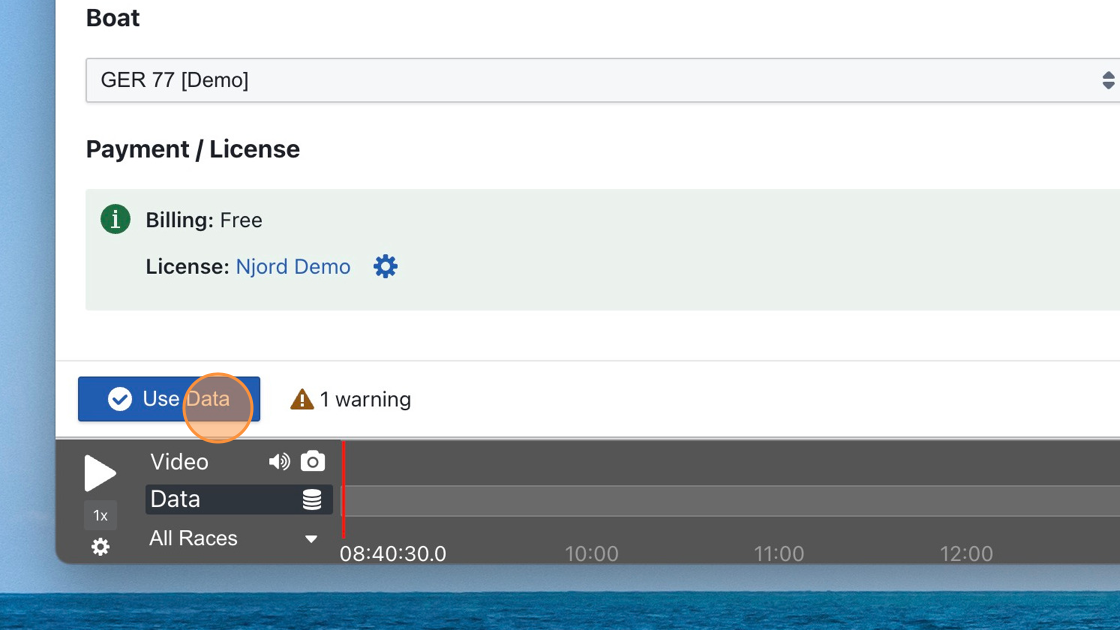
Step 6
Use the time track to seek and view the loaded data
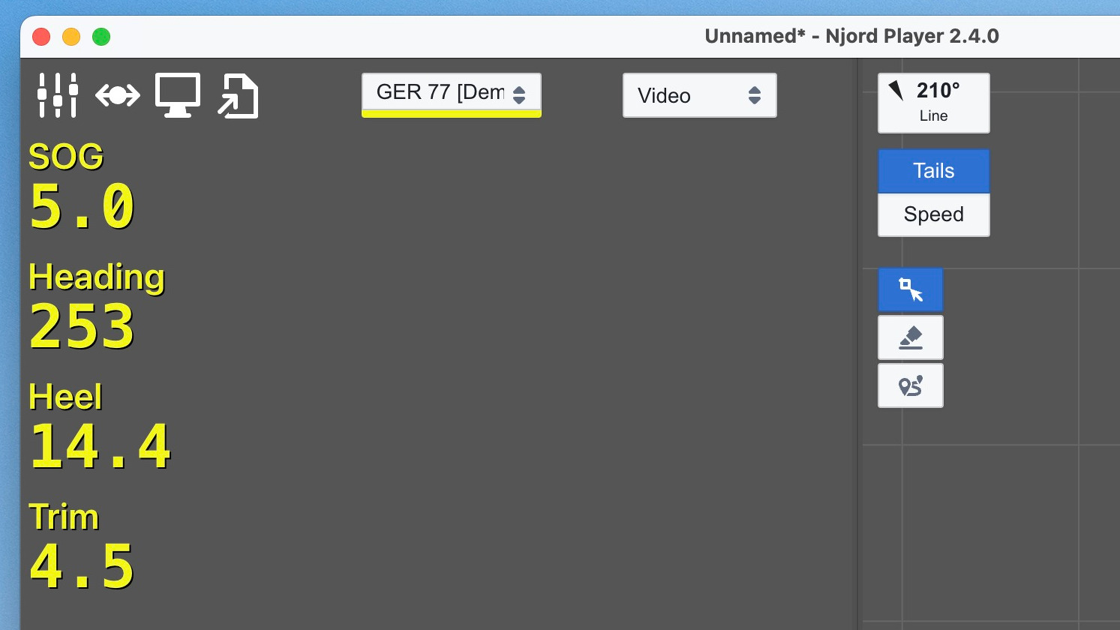
Tip: Repeat the process for more than one boat
Step 7
Click "File" / "Save" to save the Njord Player file and persist your work
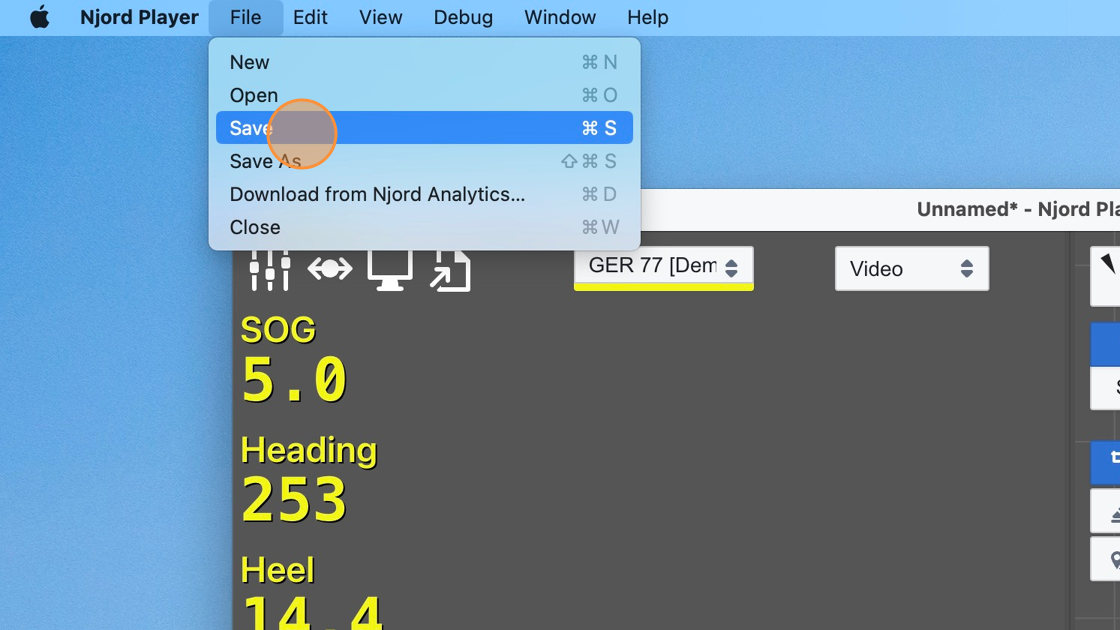
Loading Media
Adding Media and Performing Time Synchronization
Tip: Always add boat log data to Njord Player first - due to the availability of GPS time in your boat's data, it is much more likely to be accurate than video from most cameras. You can then align video relative to the boat's data to achieve the best results.
Step 1
Click on the media group that you want to add the video to, to open the media list
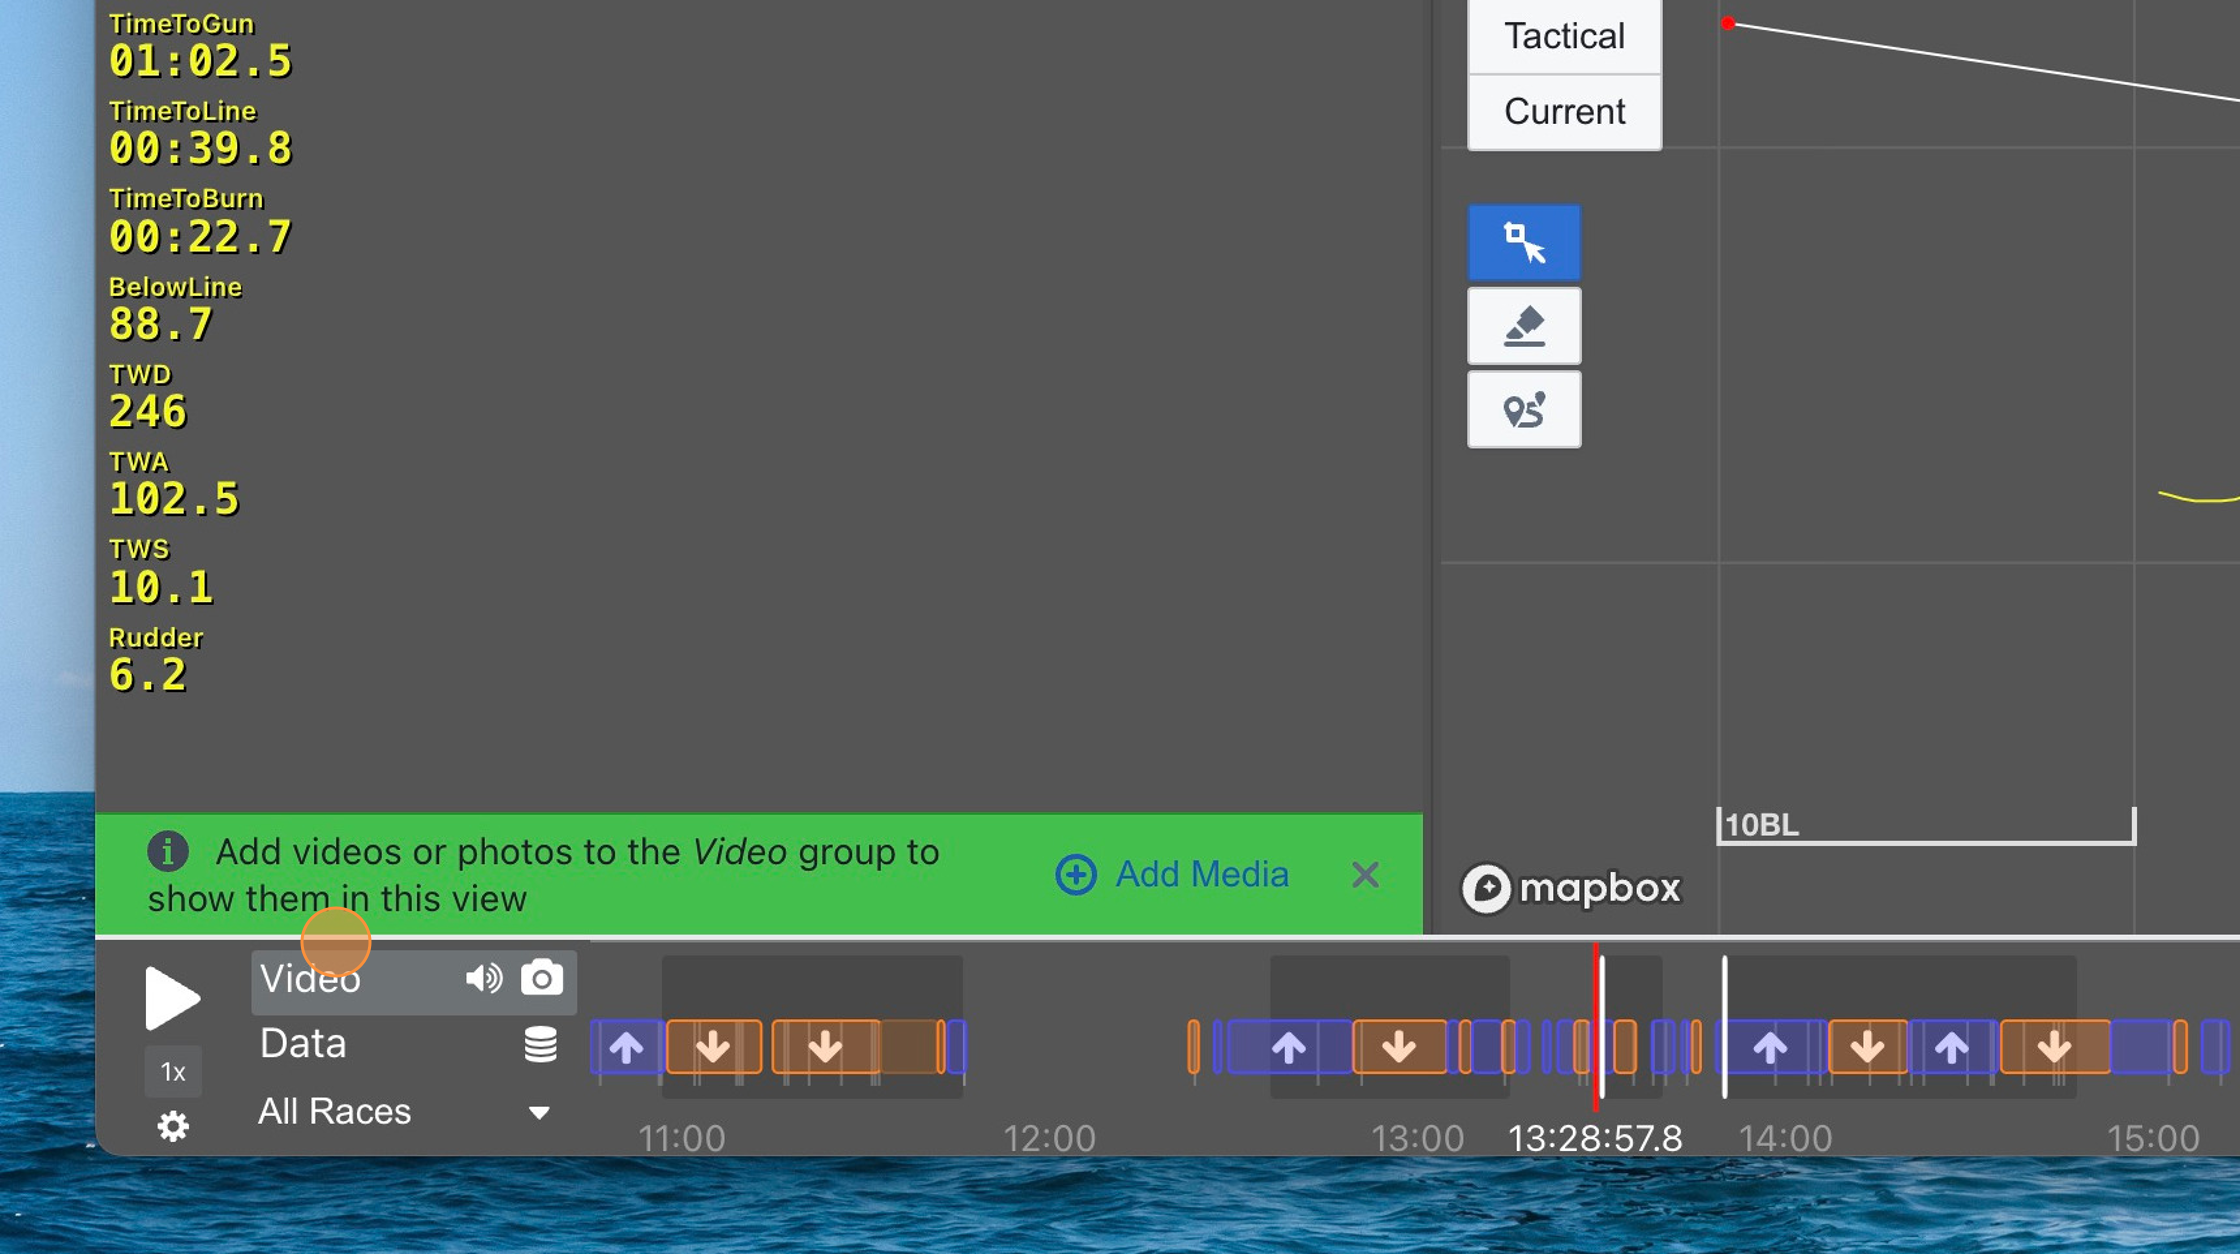
Step 2
Click "Add Media" and select the video file(s) that you want to add
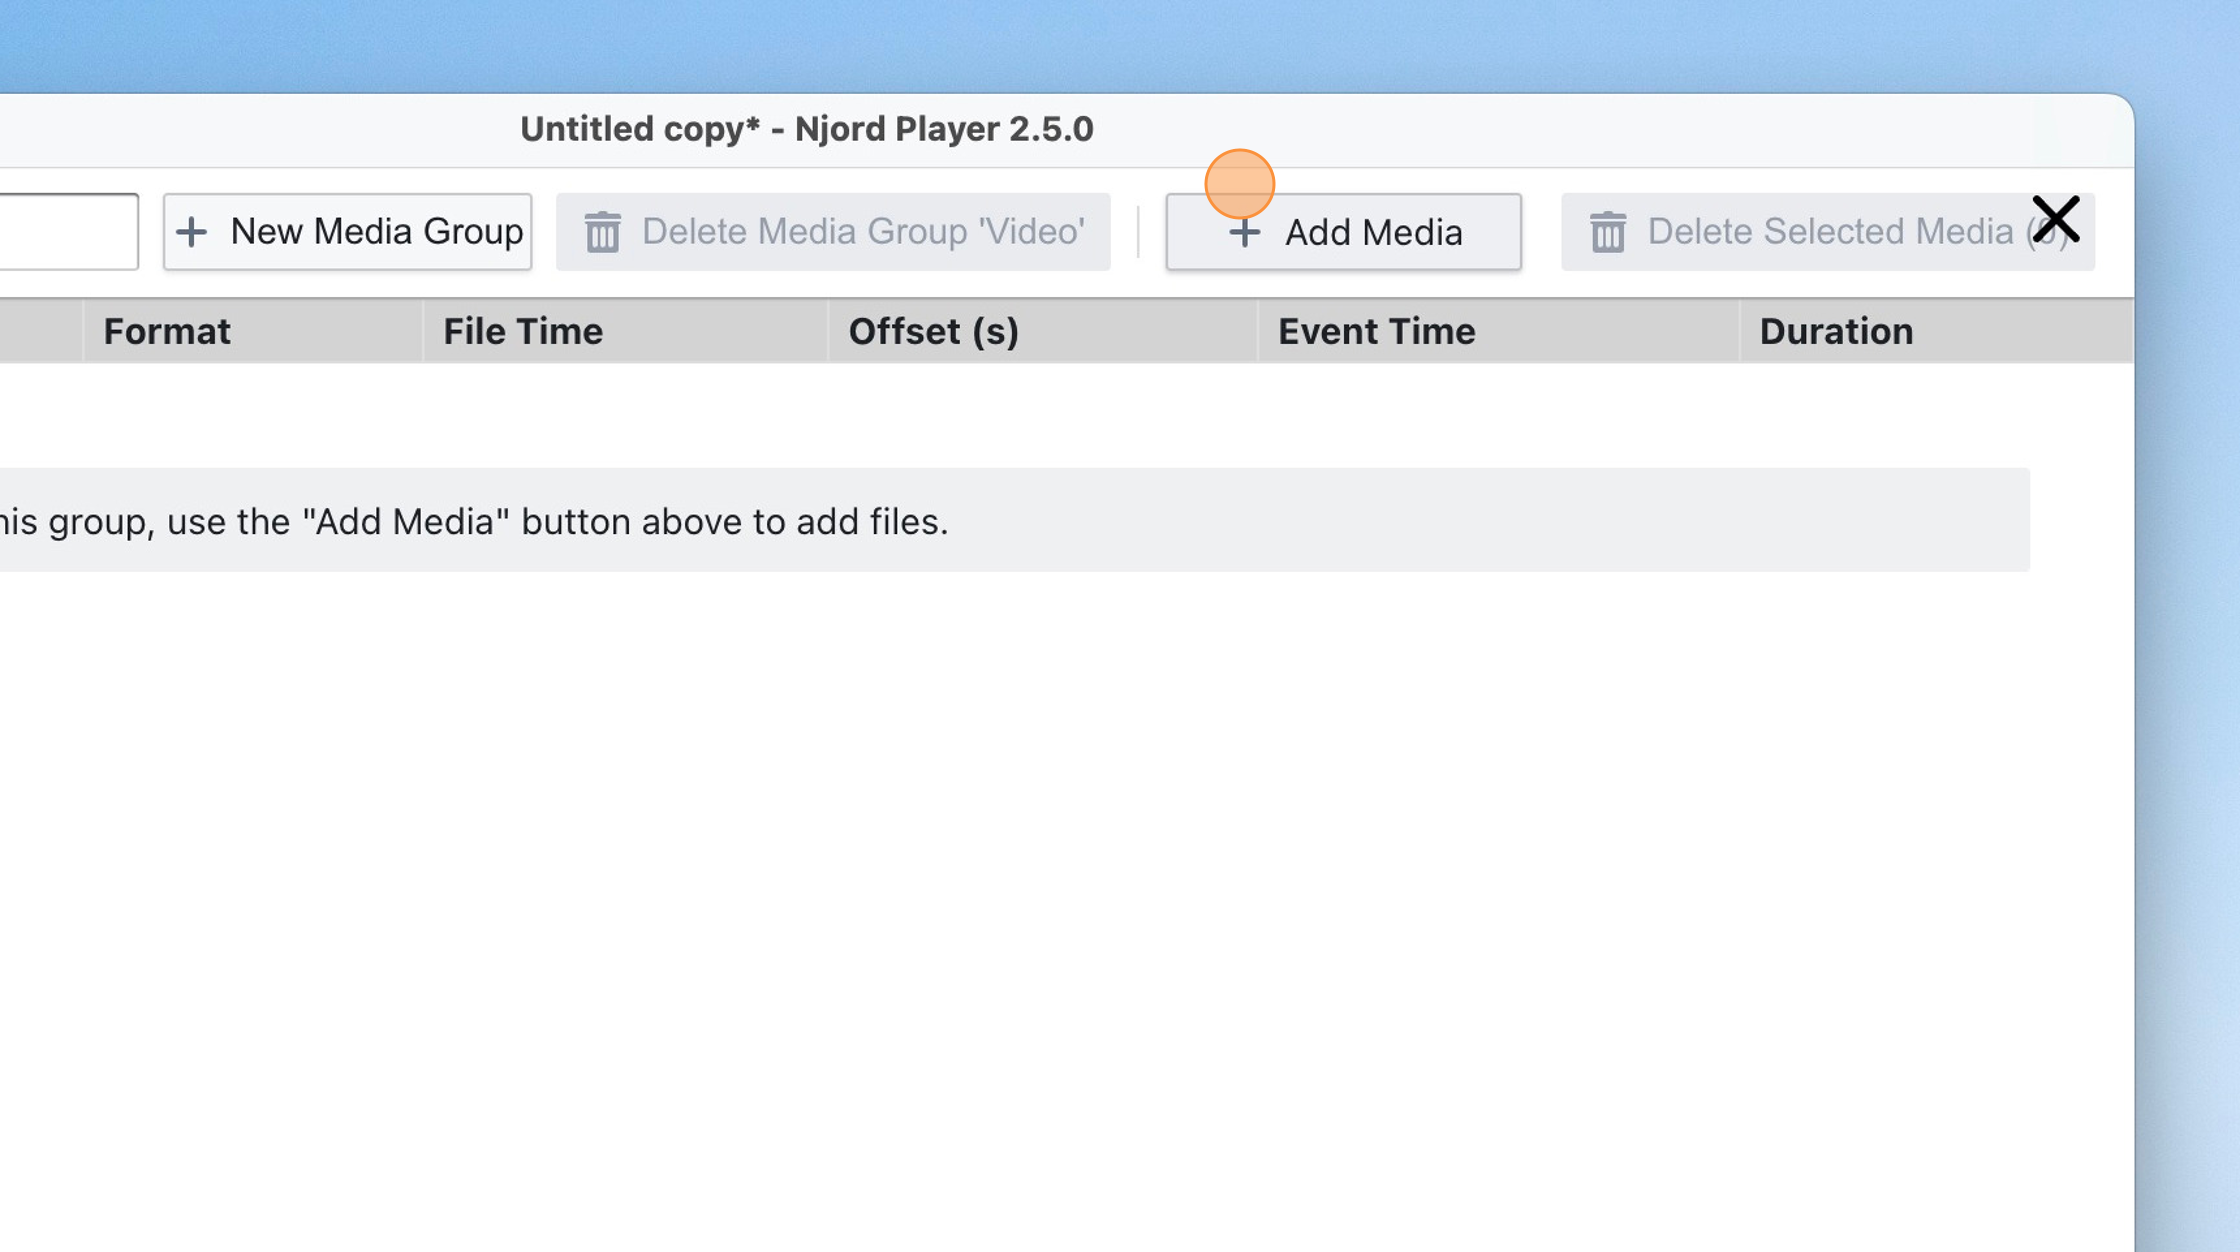
Step 3
Verify the "File Time" (in the camera's / computer's time/time zone) and the "Event Time" (translated into the Njord Player event's time zone) to spot obvious discrepancies (we will fix those below).
You will also see the added video file show up as a green box on the timeline, which gives you a general idea whether the video aligns with the correct part of your sailing data.
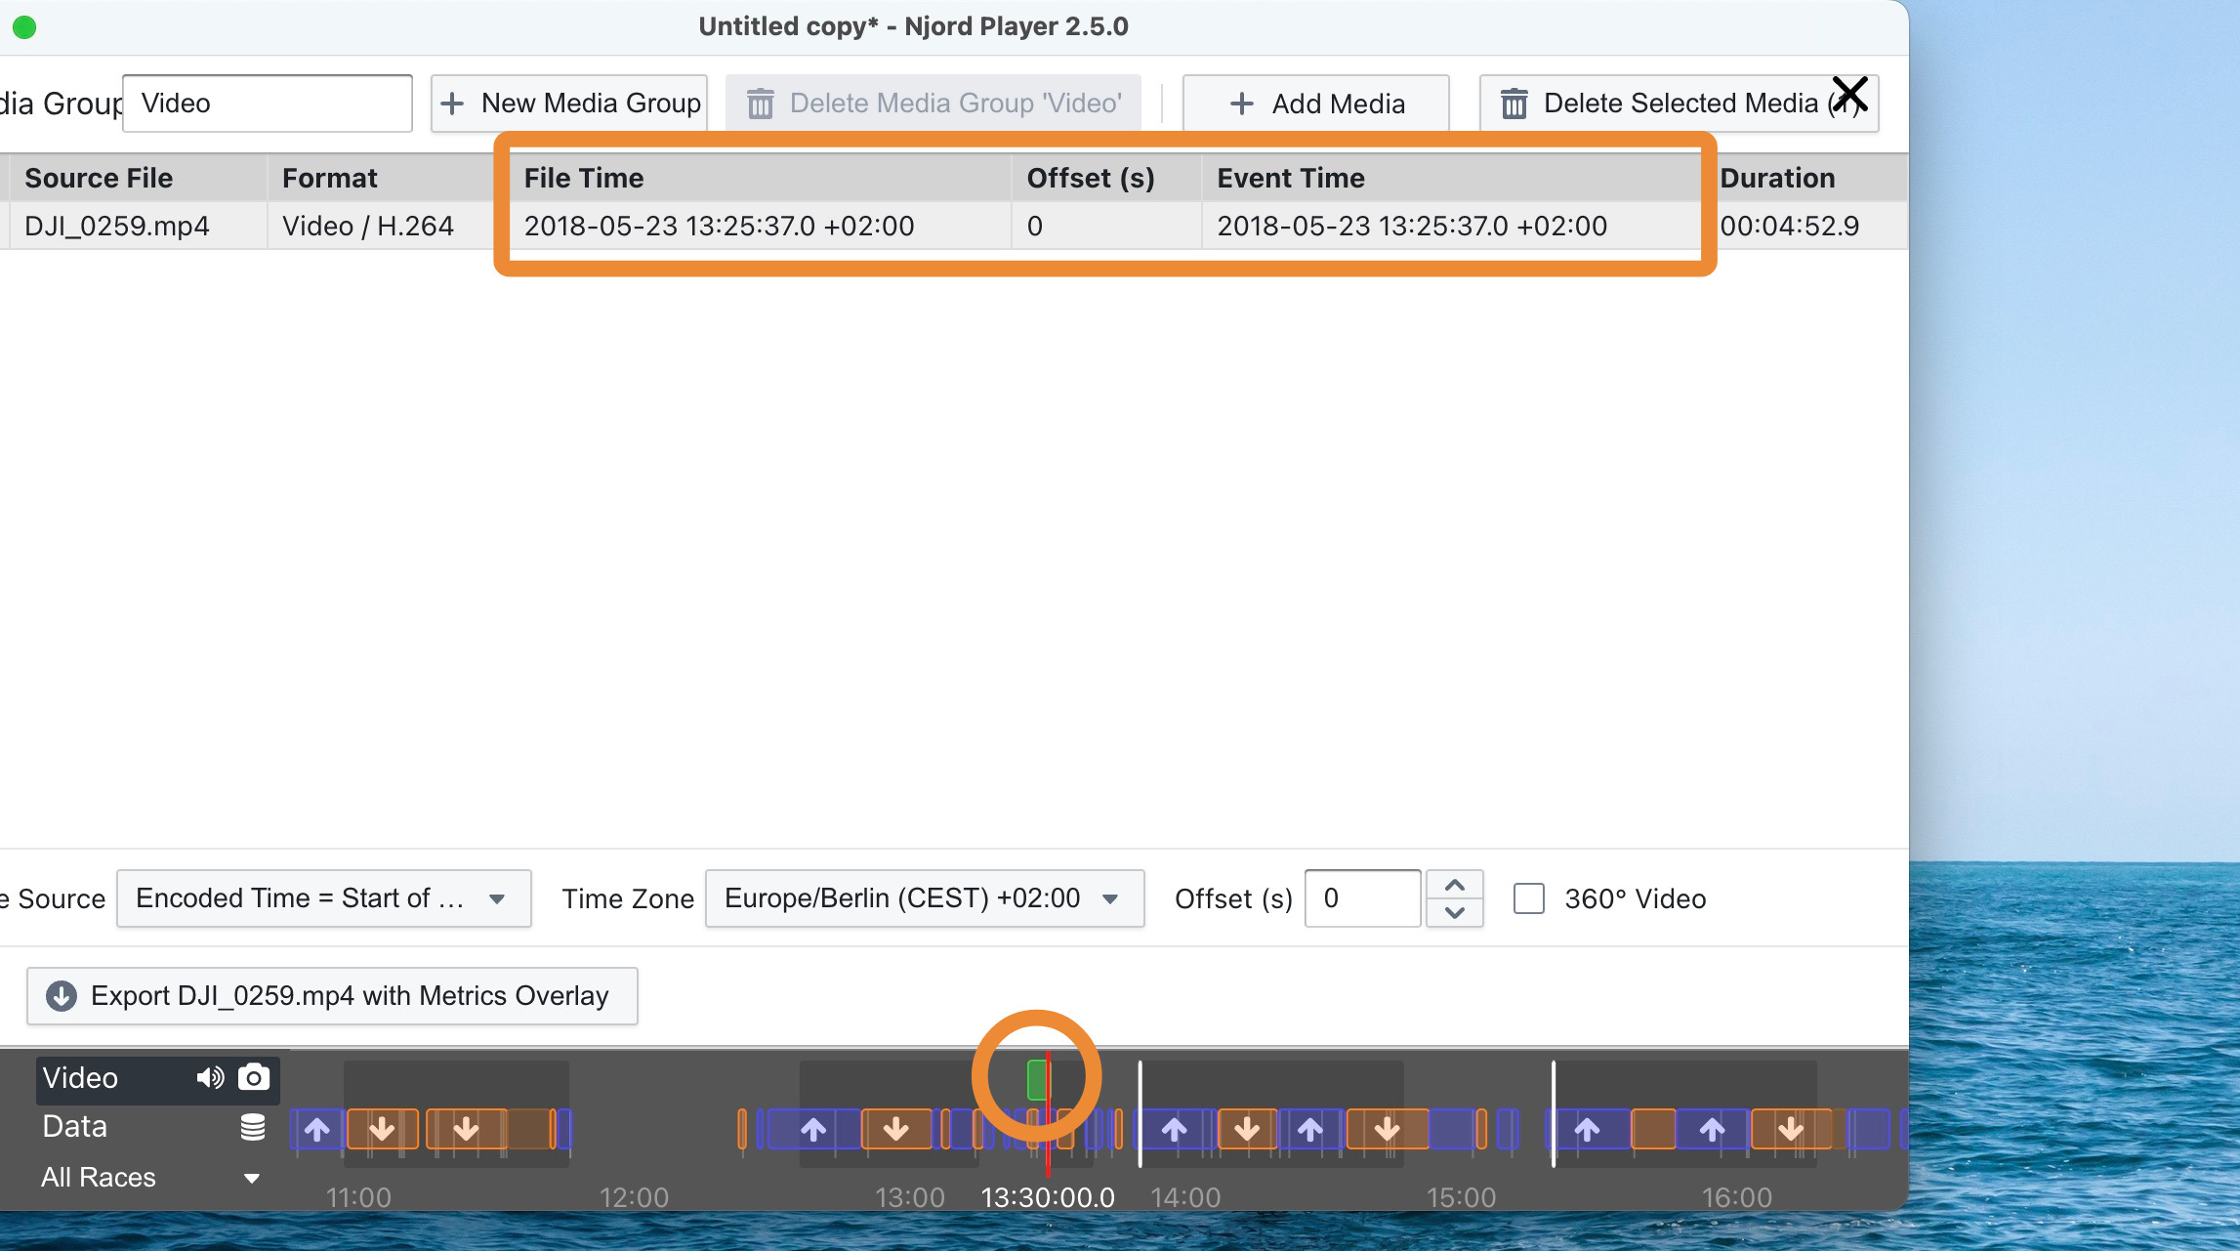
General Time Adjustment
Tip: If the video that you just loaded does not match the data at all, i.e. it is off by minutes or hours, you will most likely have to choose a different time source, or time zone. We will show how in this section.
If the video is off by a few seconds only, proceed with the "Precise Time Adjustment" section (below)
Step 4
Select the video file(s) whose time is off by minutes or hours
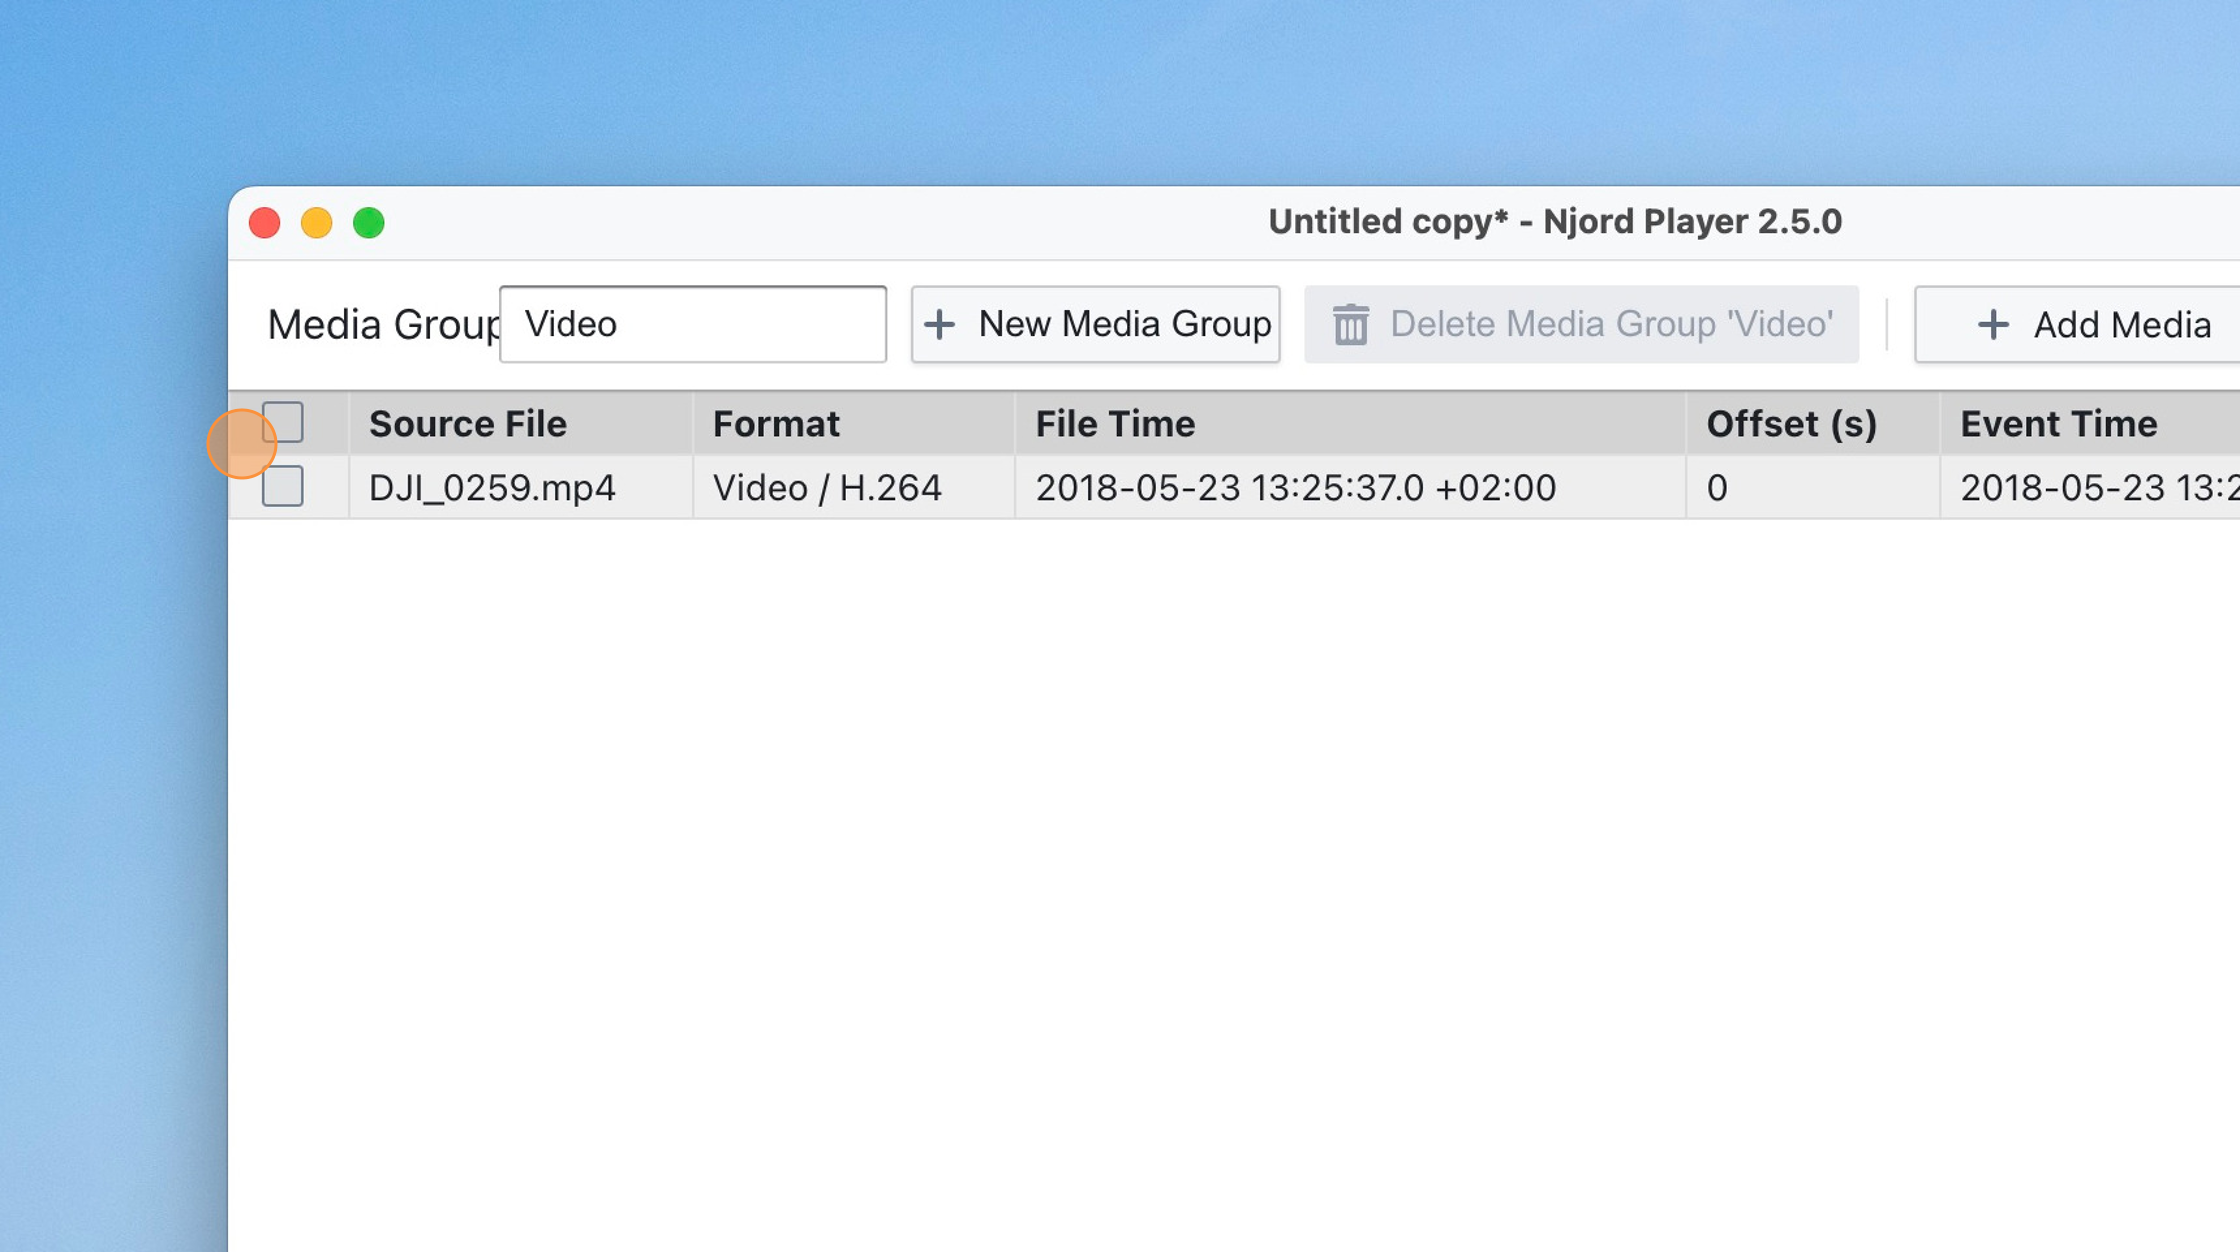
Step 5
Click "Time Source"
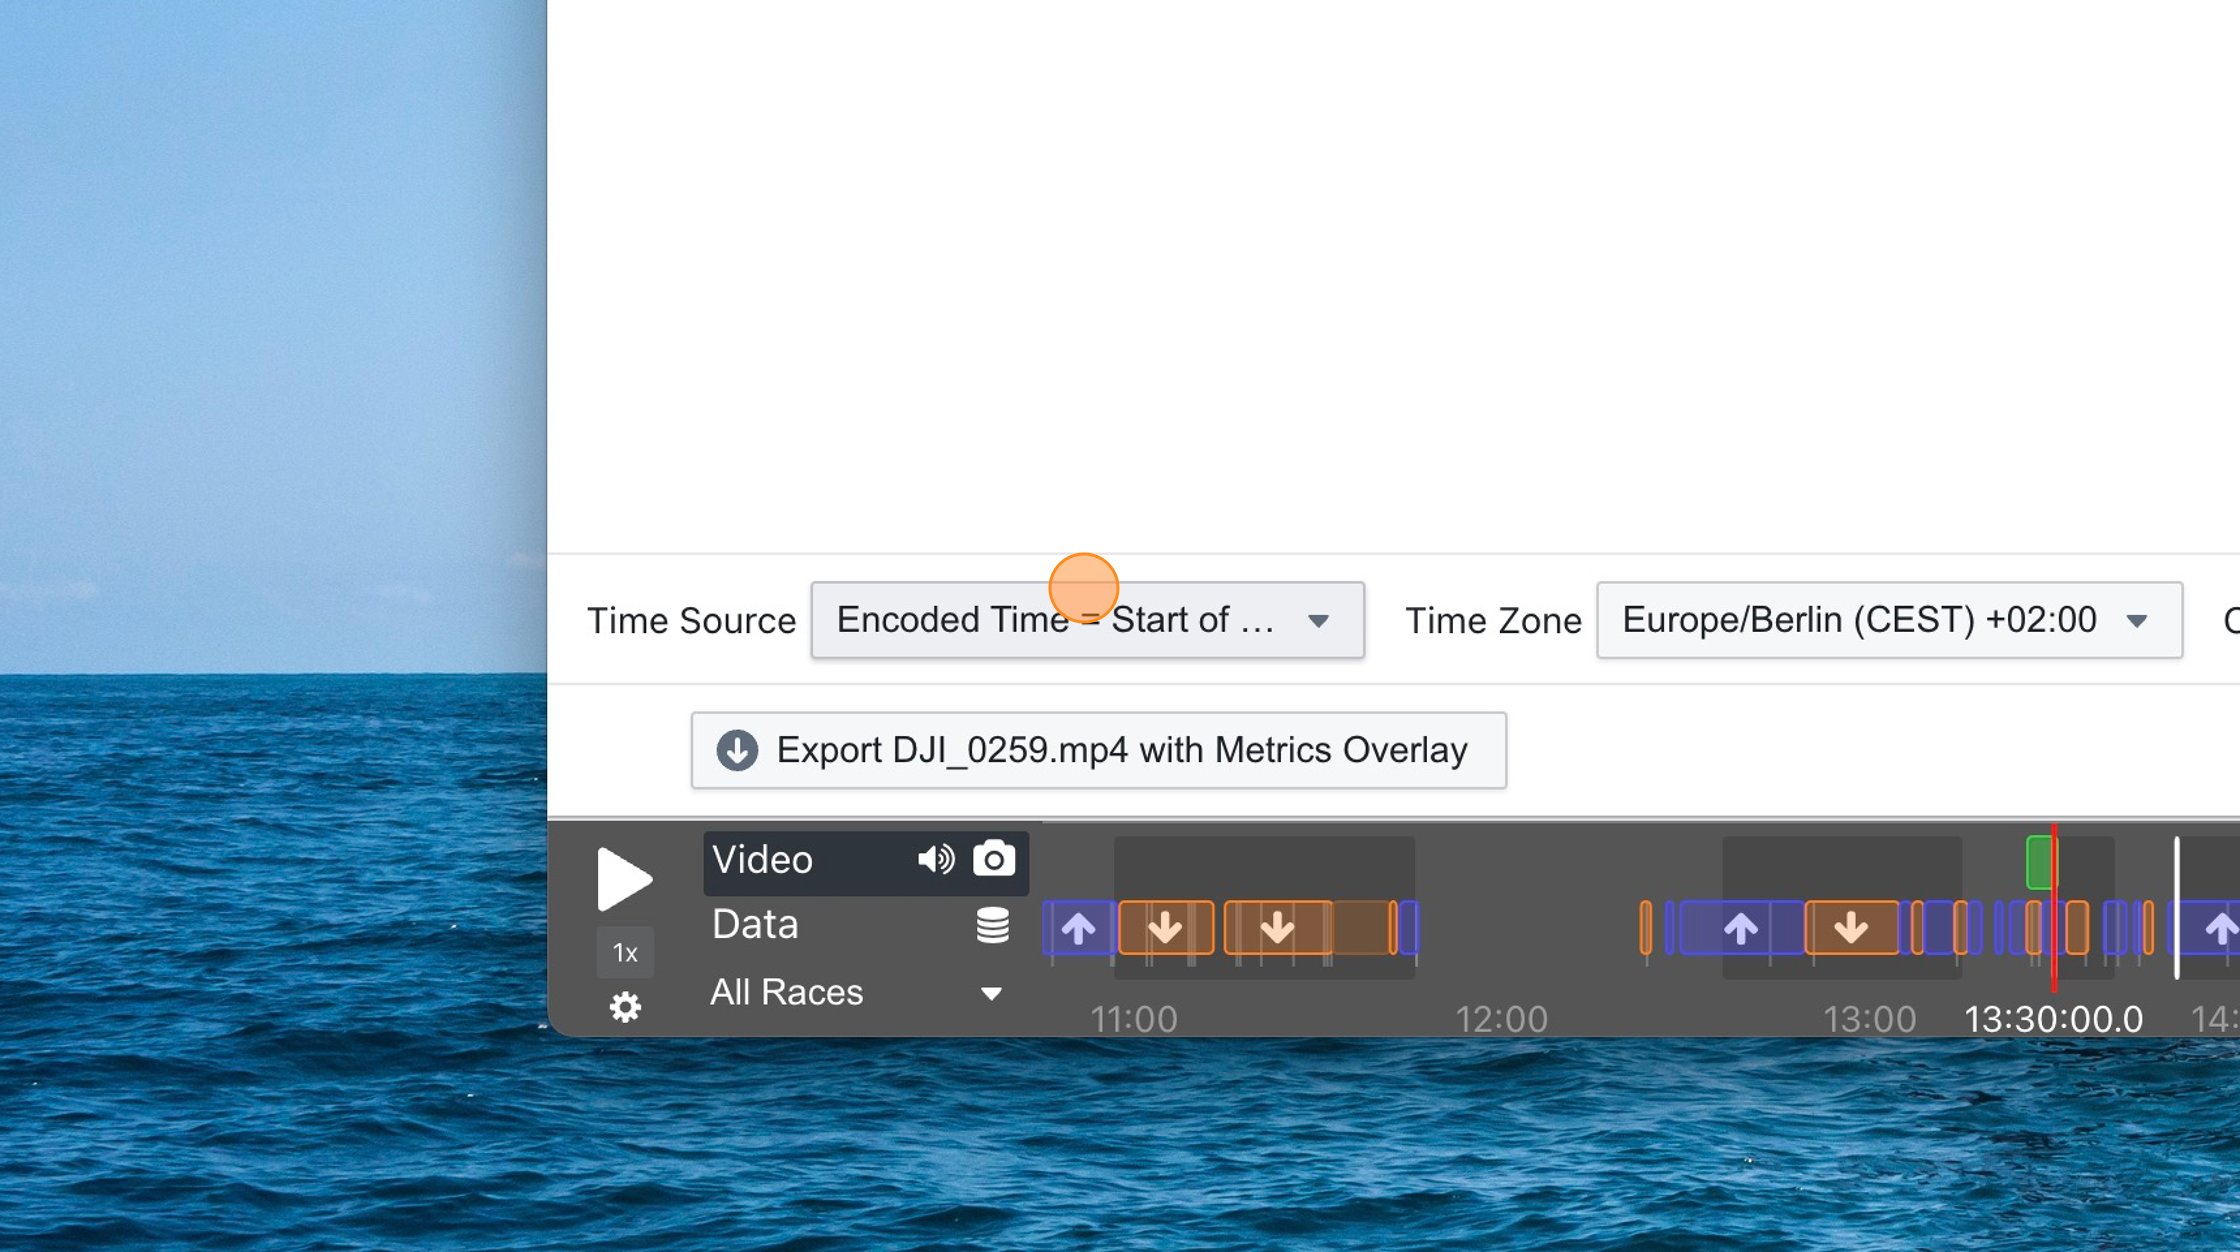
Step 6
Video files contain multiple timestamps that relate to different events (recording the video, storing it on the memory card, etc.) and depending on the camera, such a timestamp can either denote the start of the video, or the end of the video.
See if any of the options are plausible. Some trial & error may be required, but once you know the settings to use for a certain camera, next time will be easier.
You can also change this setting for multiple video files at the same by selecting all files from the same camera.
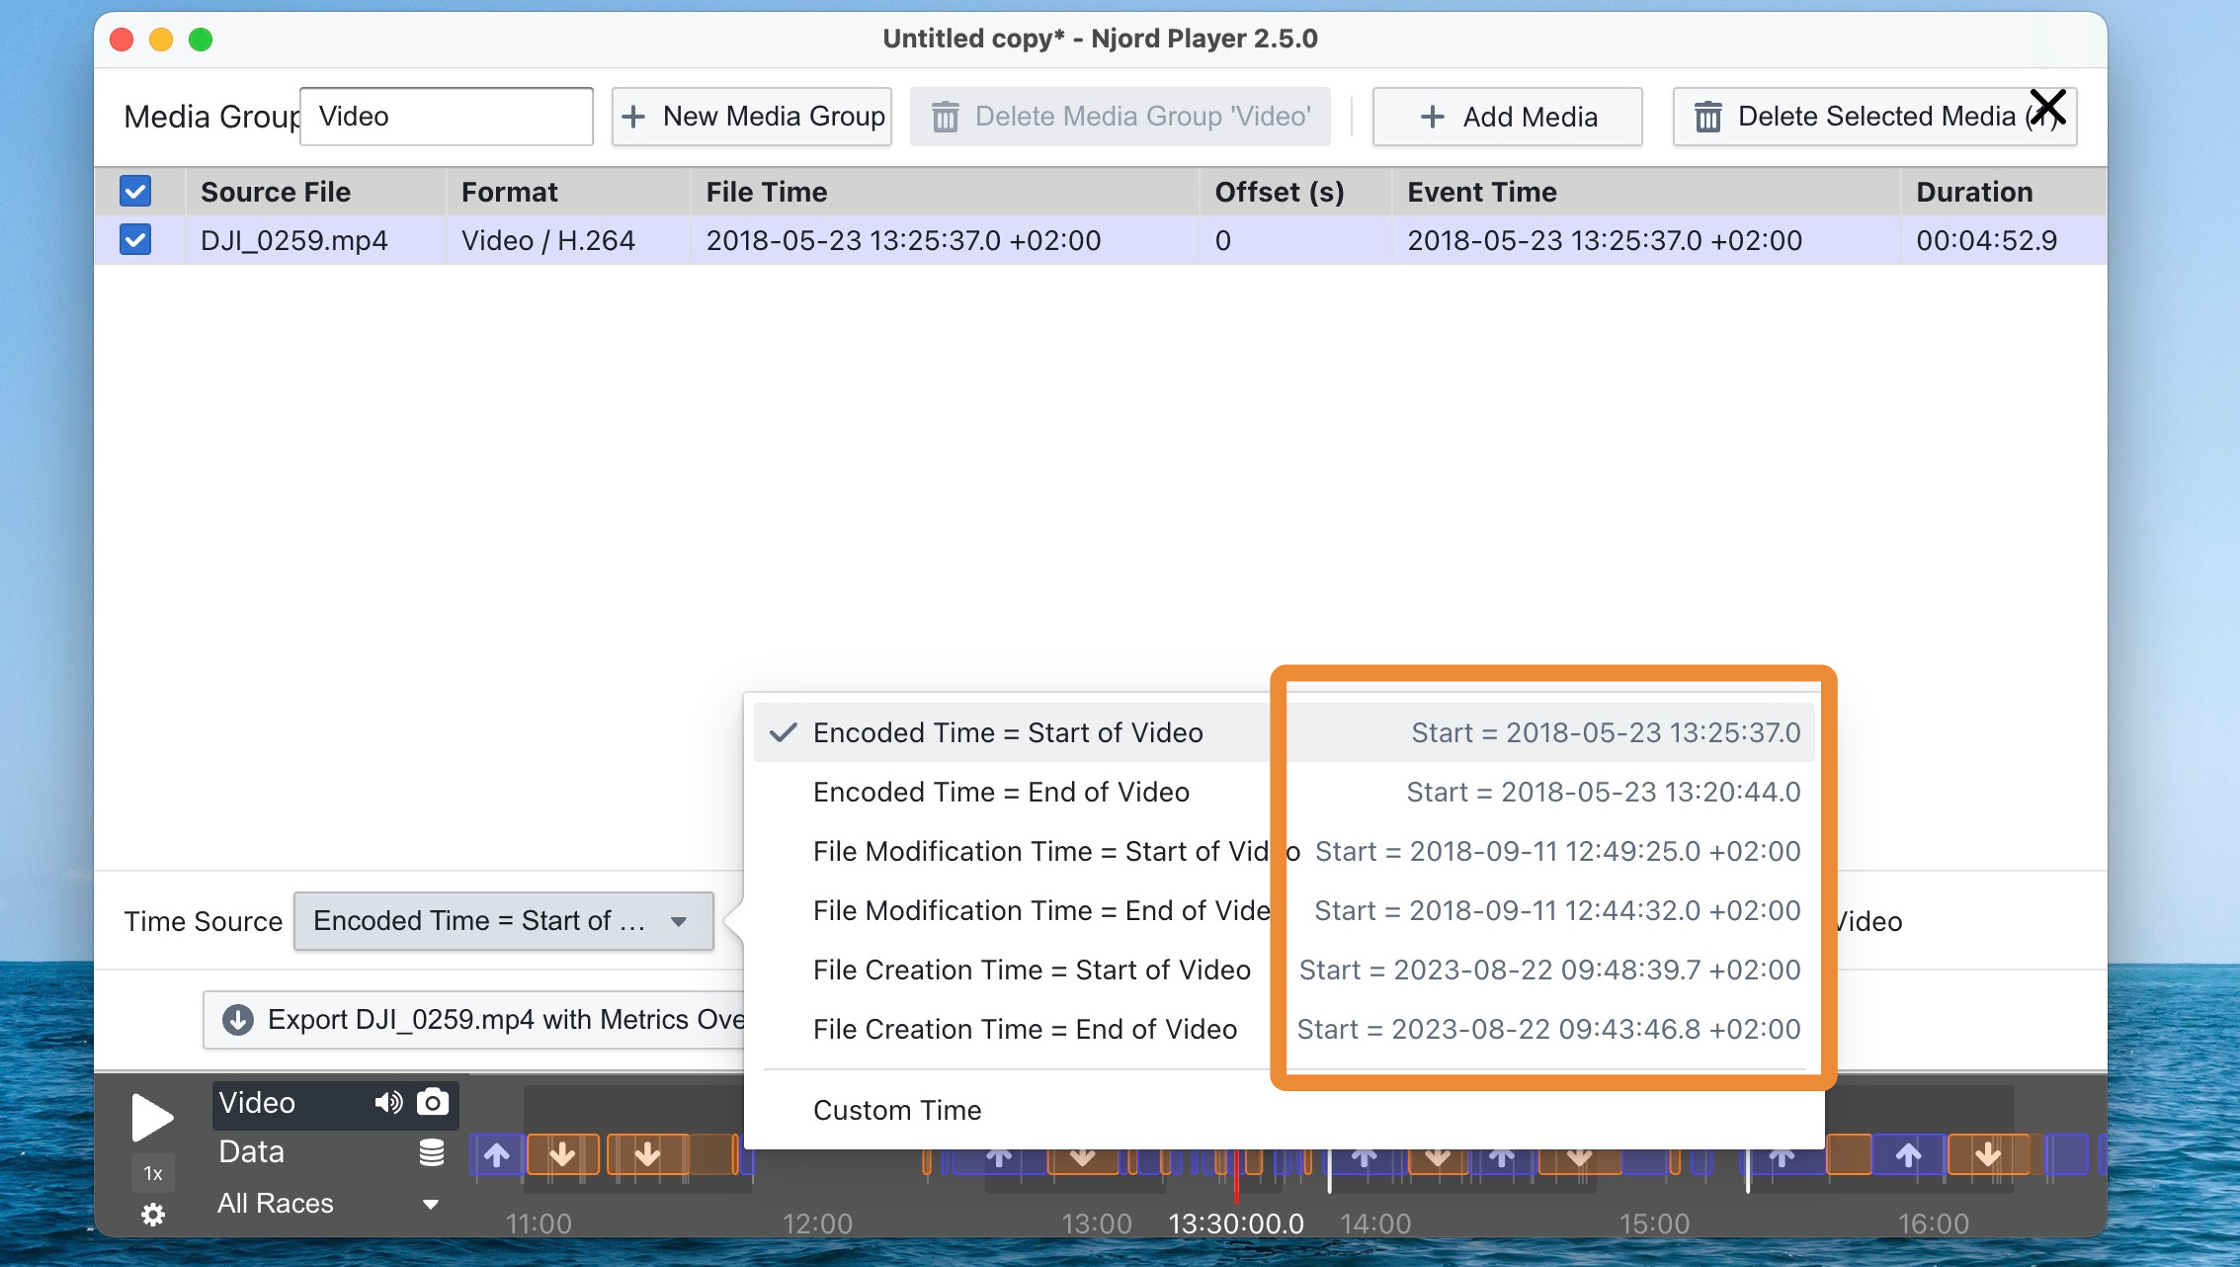
Step 7
If the time is off by a few hours exactly, it's possible that the time zone settings on your camera or computer are off. You can correct this by selecting the camera's time zone in the "Time Zone" field.
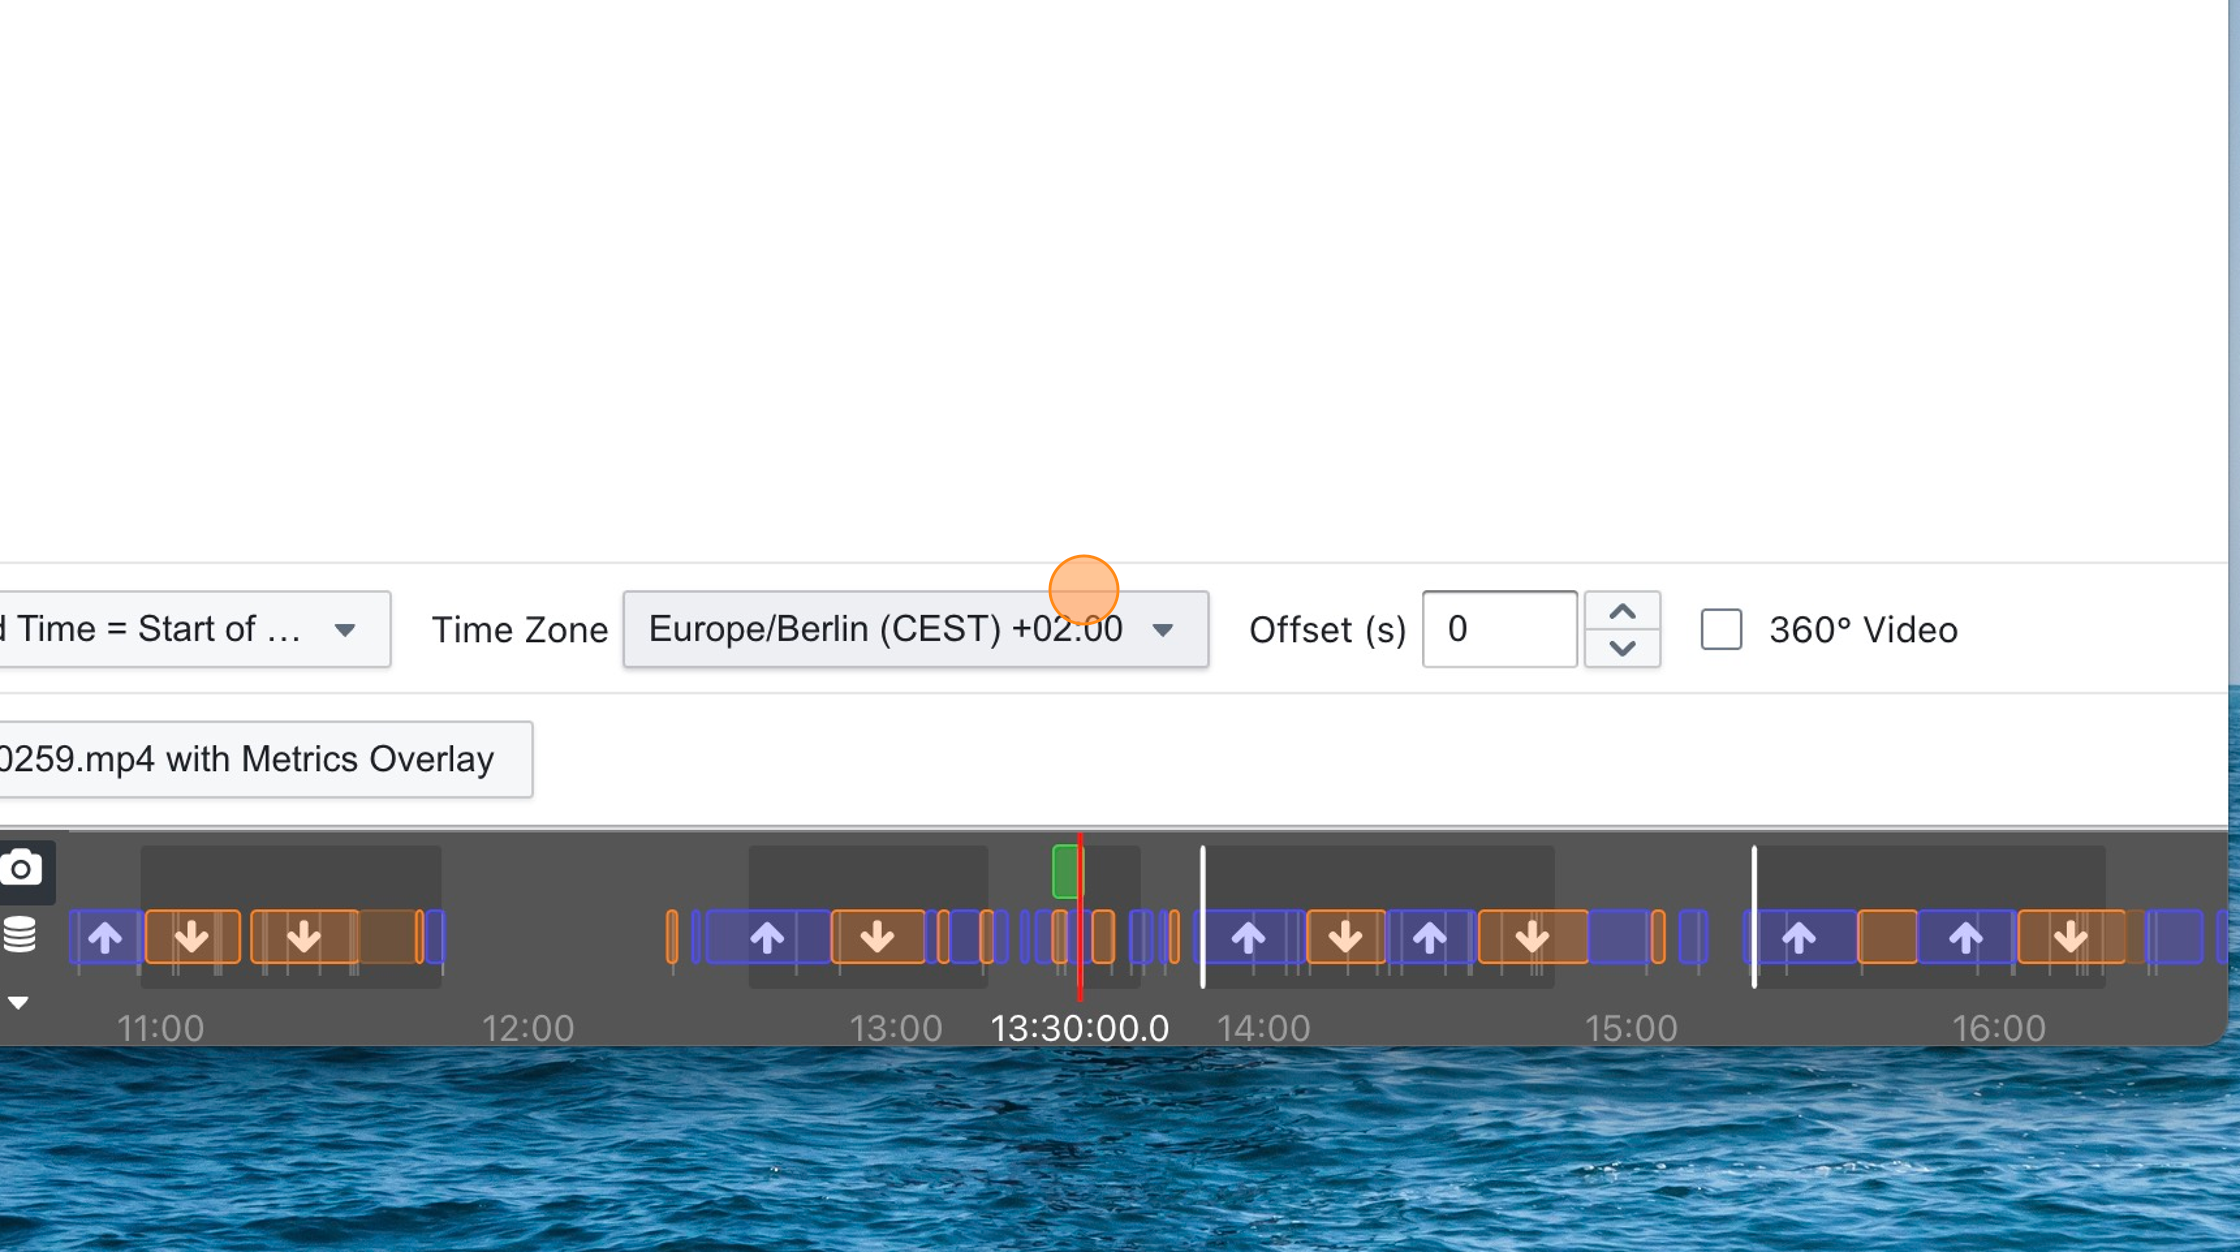
Precise Time Adjustment
Tip: Most cameras' videos will be off by up to a few seconds even if you synchronize the time before sailing (as is recommended). To correct this small error, use visual cues from the video to achieve sub-second alignment precision.
Step 8
Seek to a time that is suitable to verify the time alignment of your video. This could be a start, or a maneuver. Use the left/right arrow keys to seek more precisely.
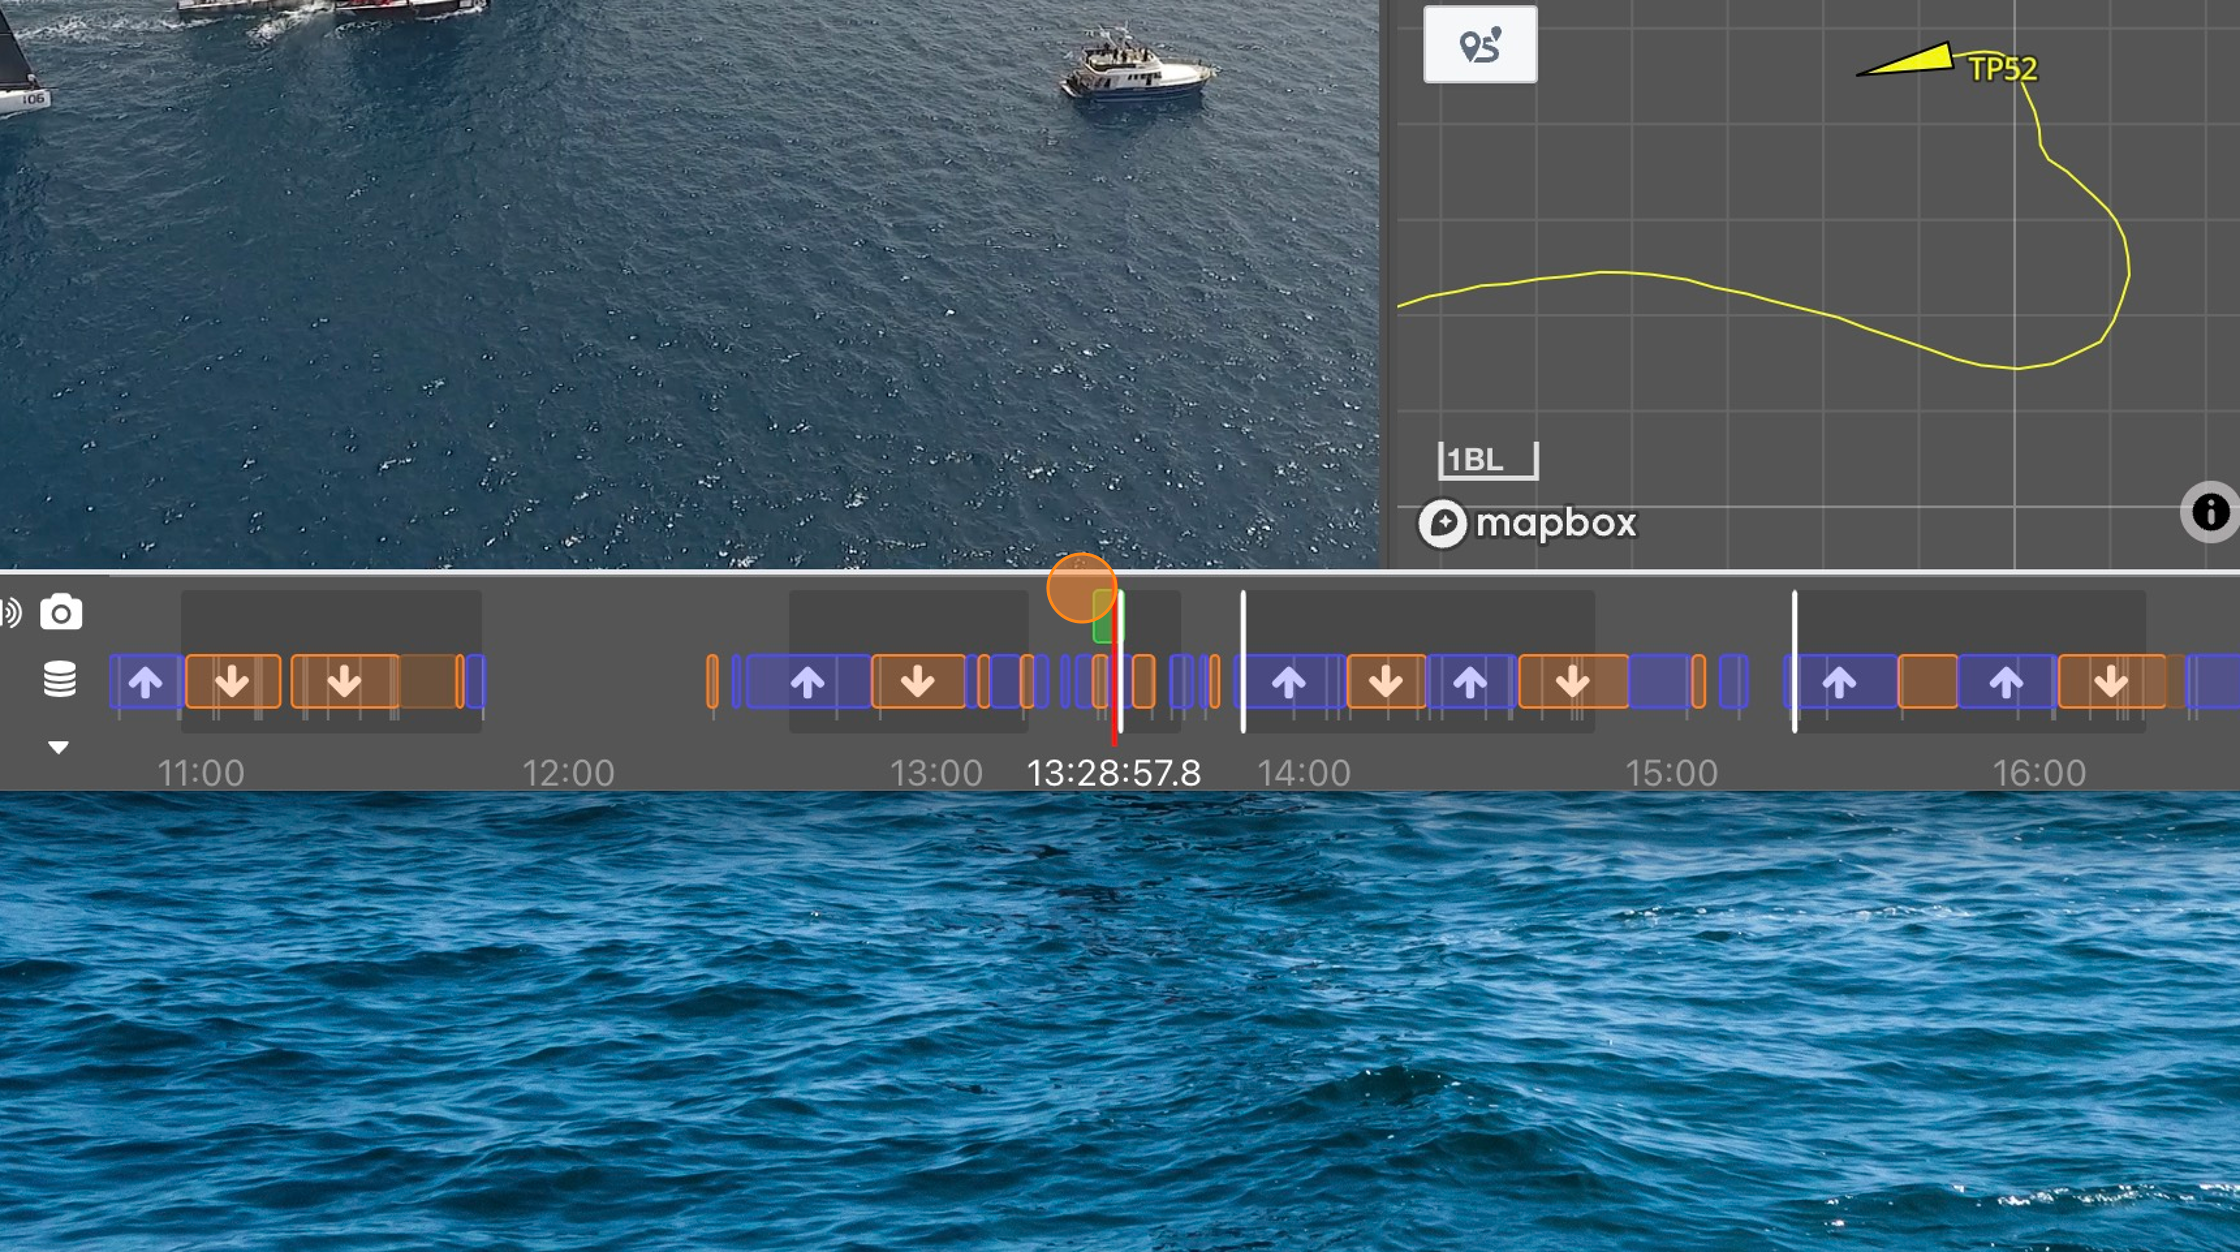
Step 9
Click on the Time Offset Adjustment icon
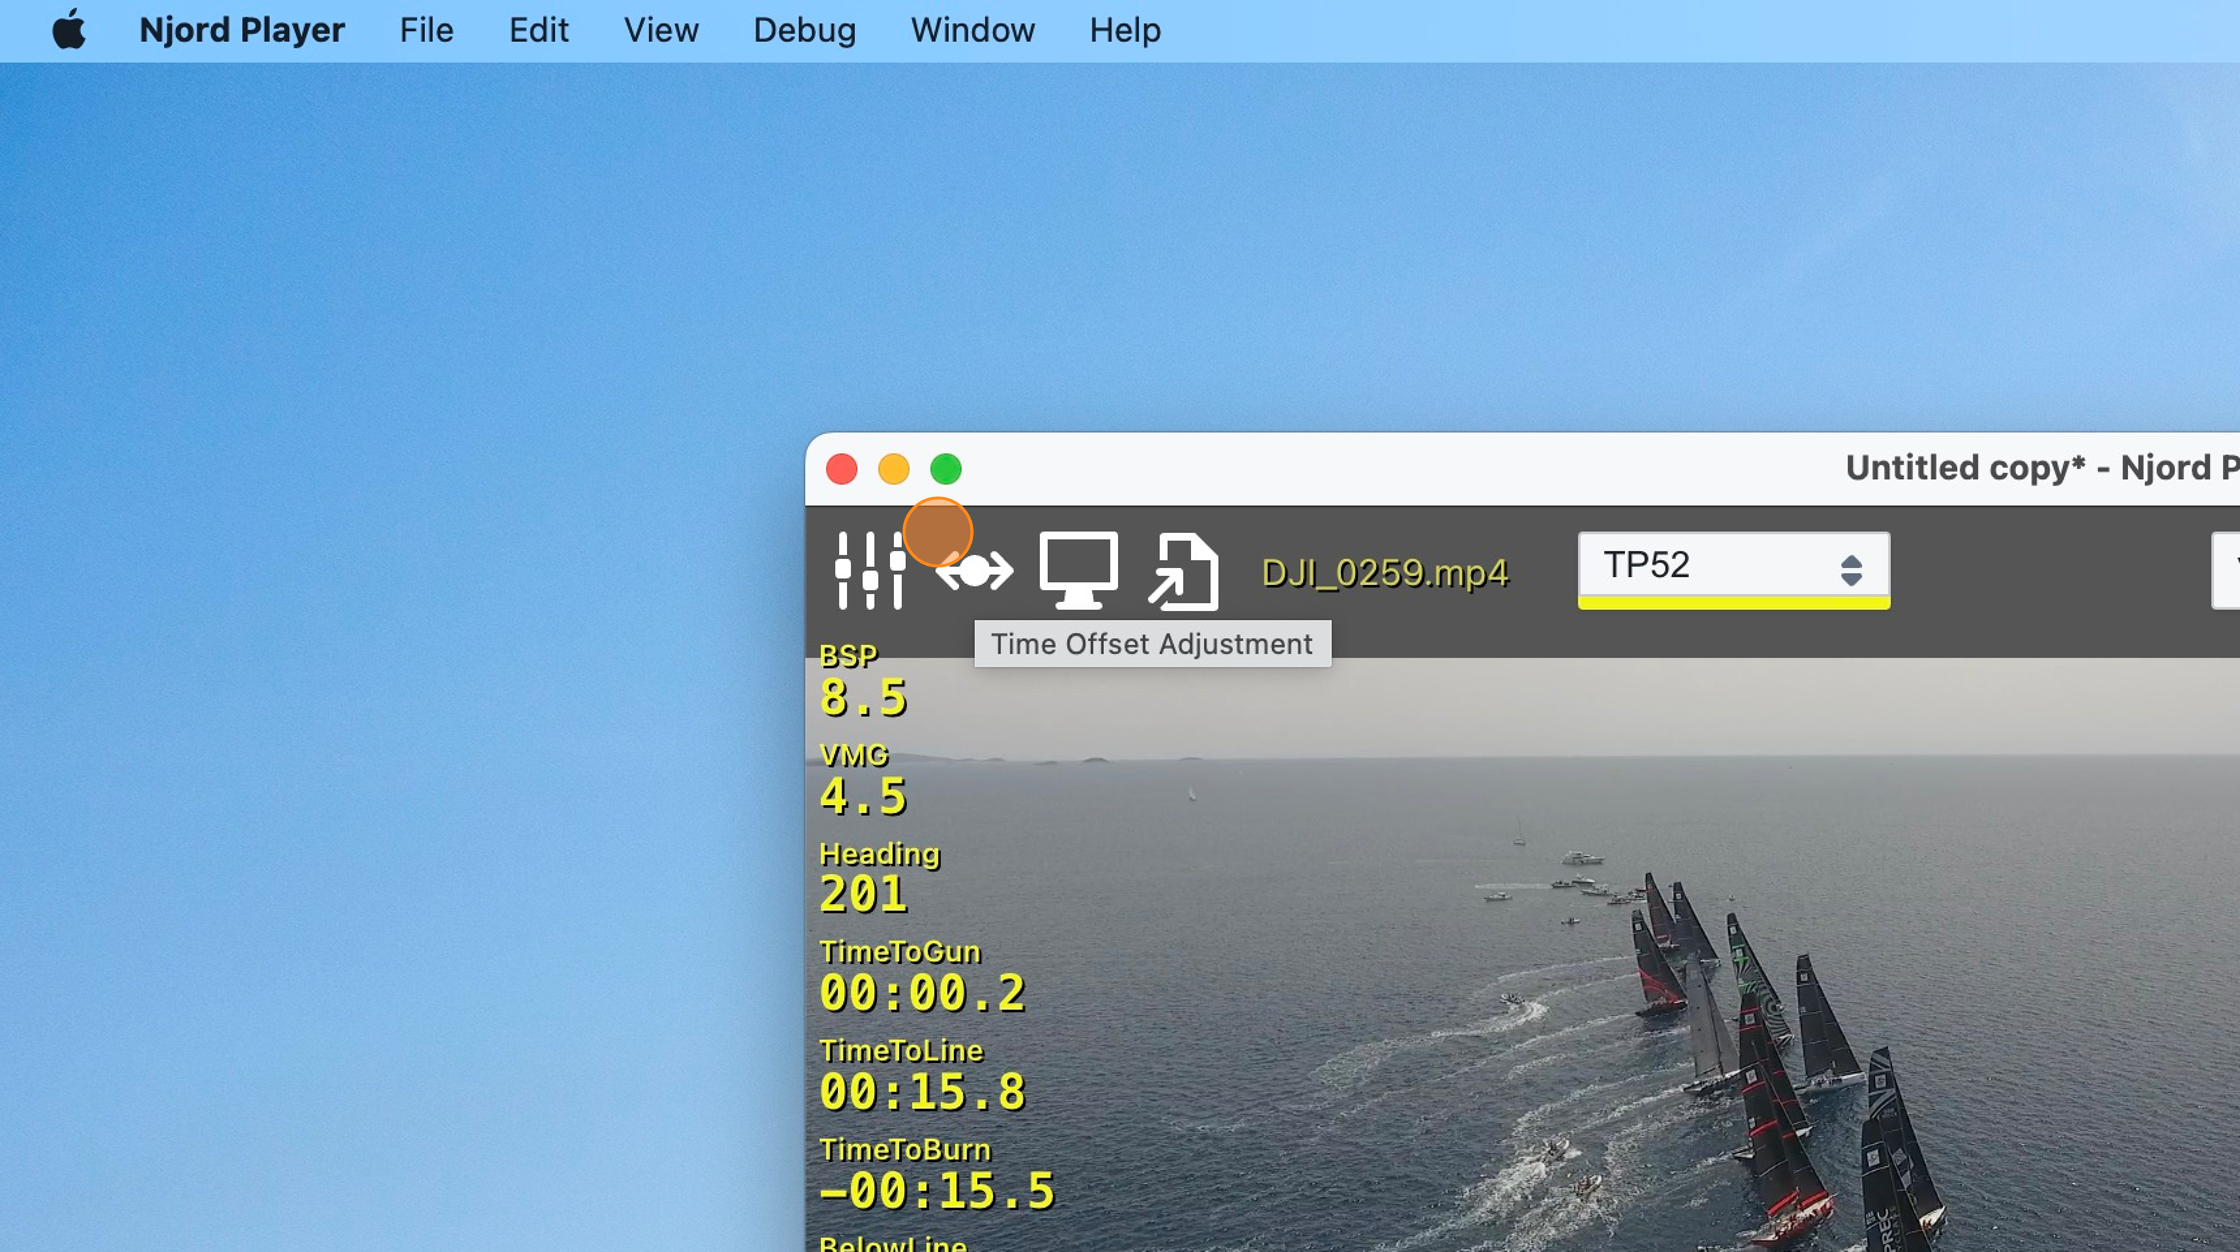
Step 10
If you have navigated to the precise timestamp that you want to synchronize the video to, select "Maintain timeline playback position". We will use this method in our example.
If you have navigated to the precise video frame that you want to synchronize the timeline to, select "Maintain current frame". Adjusting the relative offset between data and video works in the opposite direction in this case.
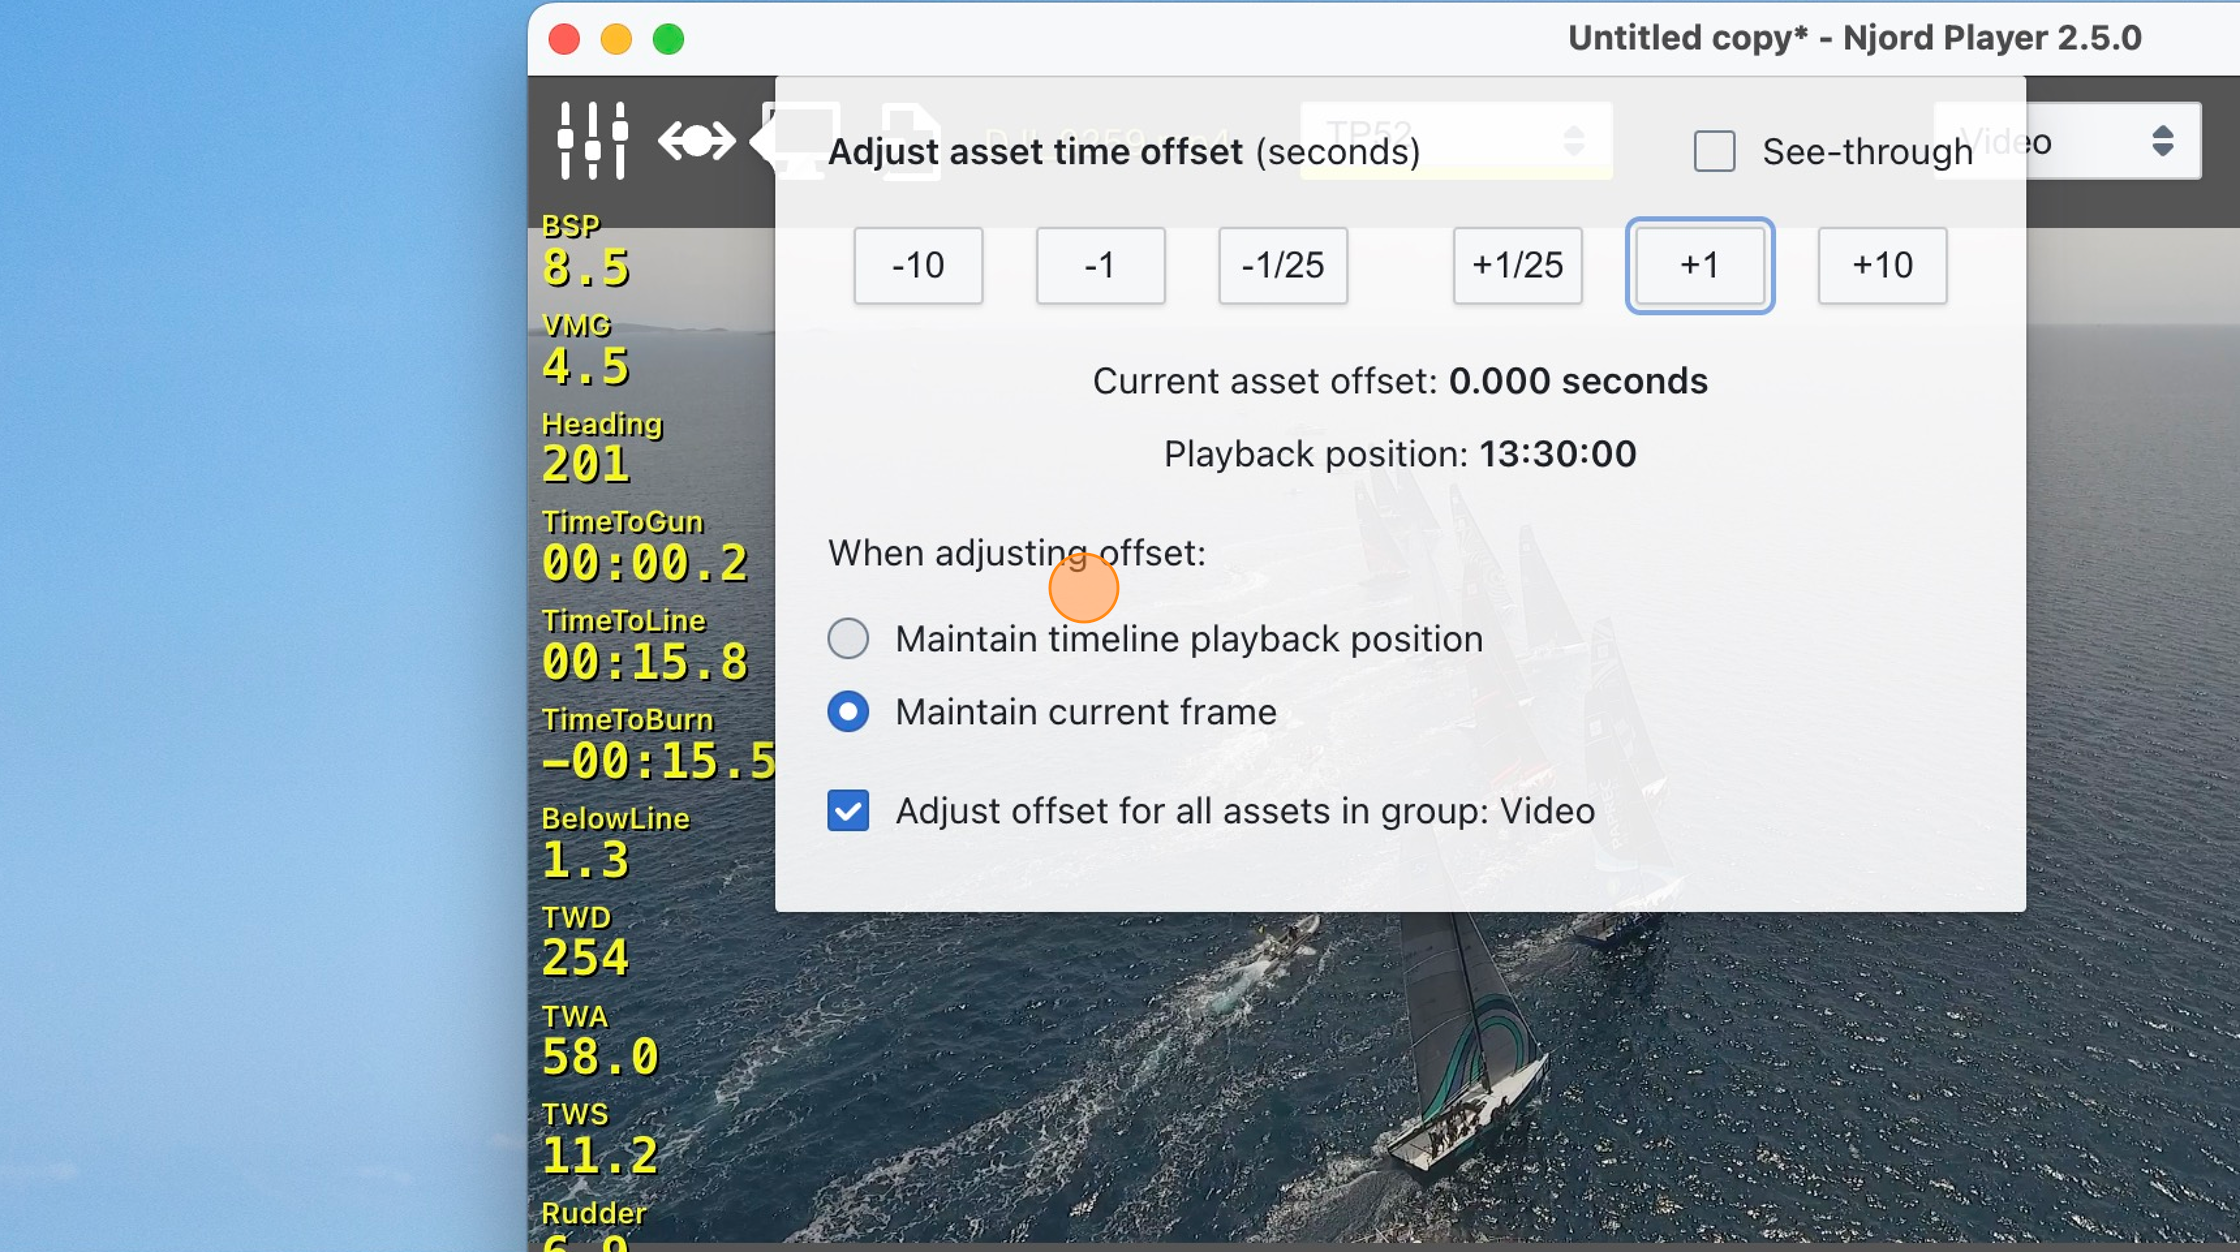
Step 11
Enable "See-through" mode if you need to see the video behind the overlay
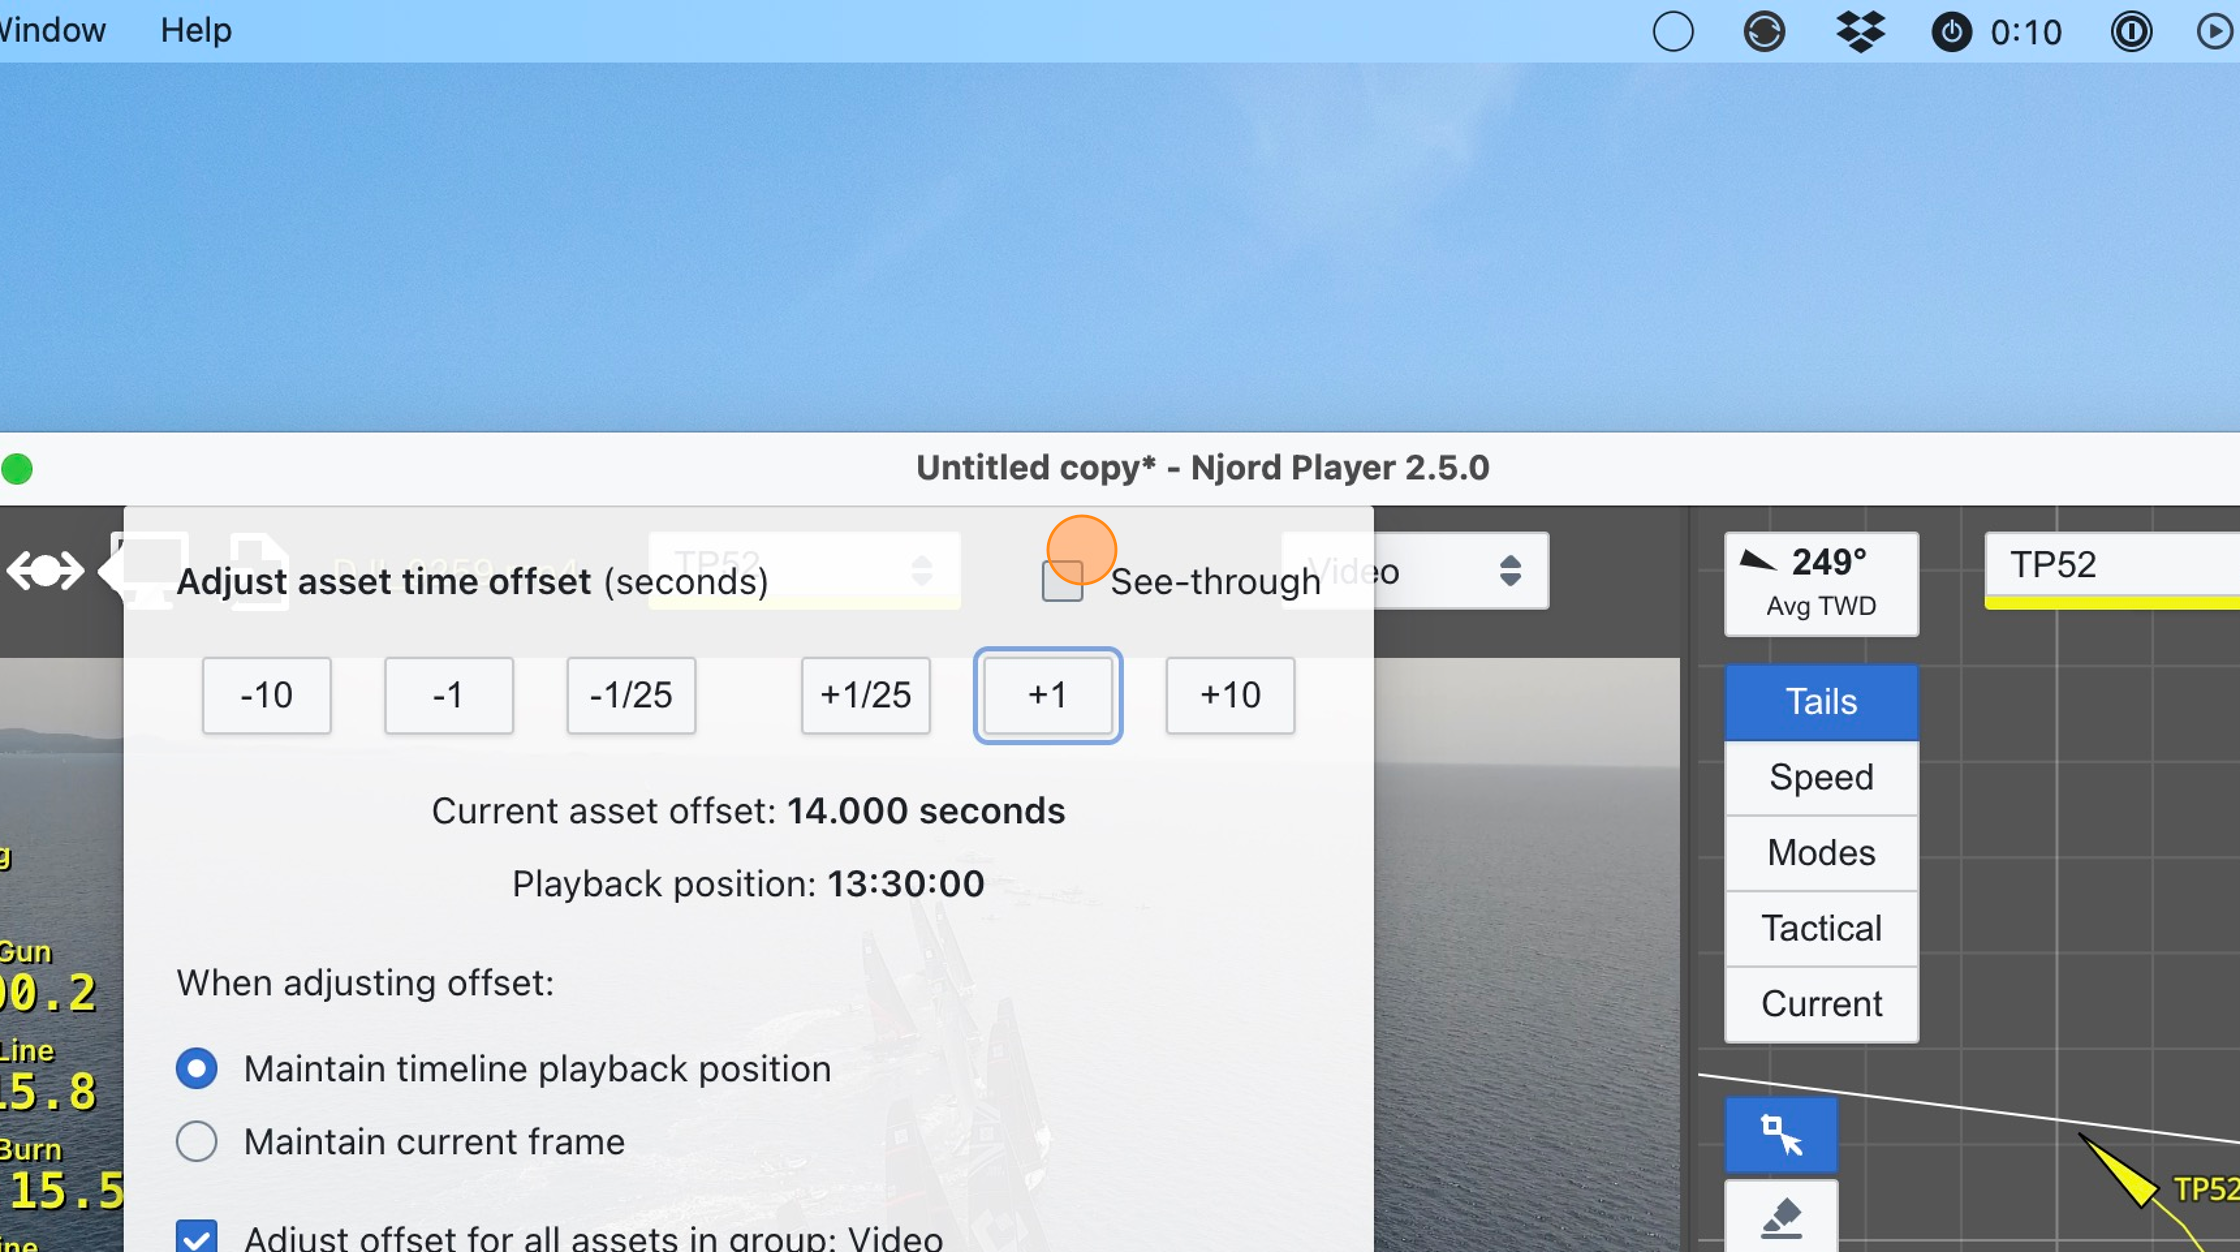
Step 12
Adjust the video asset time offset by pressing plus or minus buttons, until you are happy with the result.
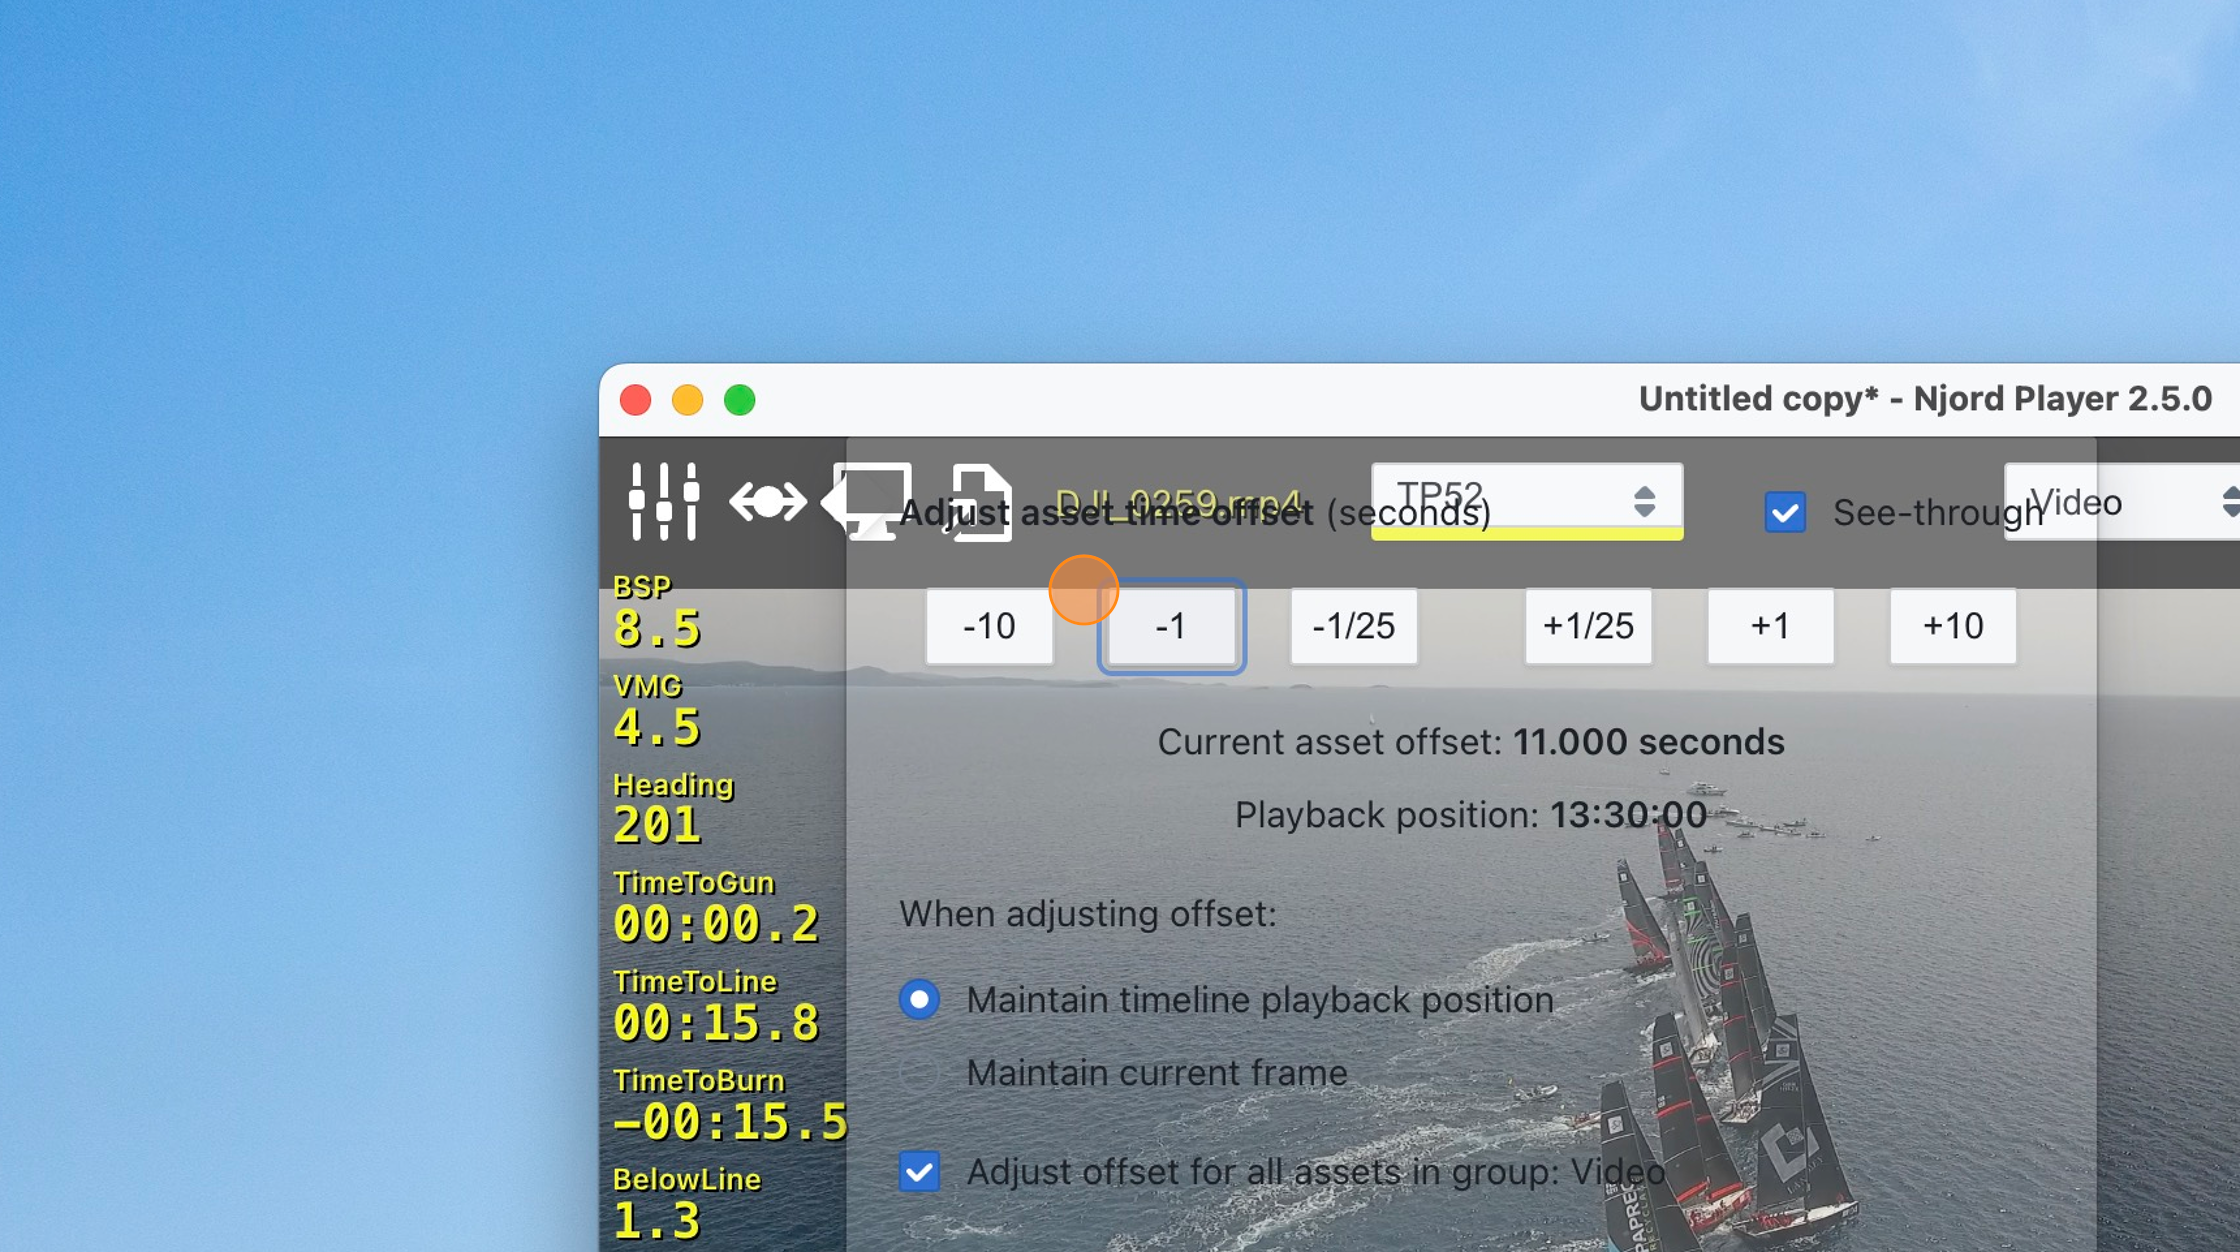
Step 13
In this instance, we have used the position of the boat relative to the start line to synchronize video with data
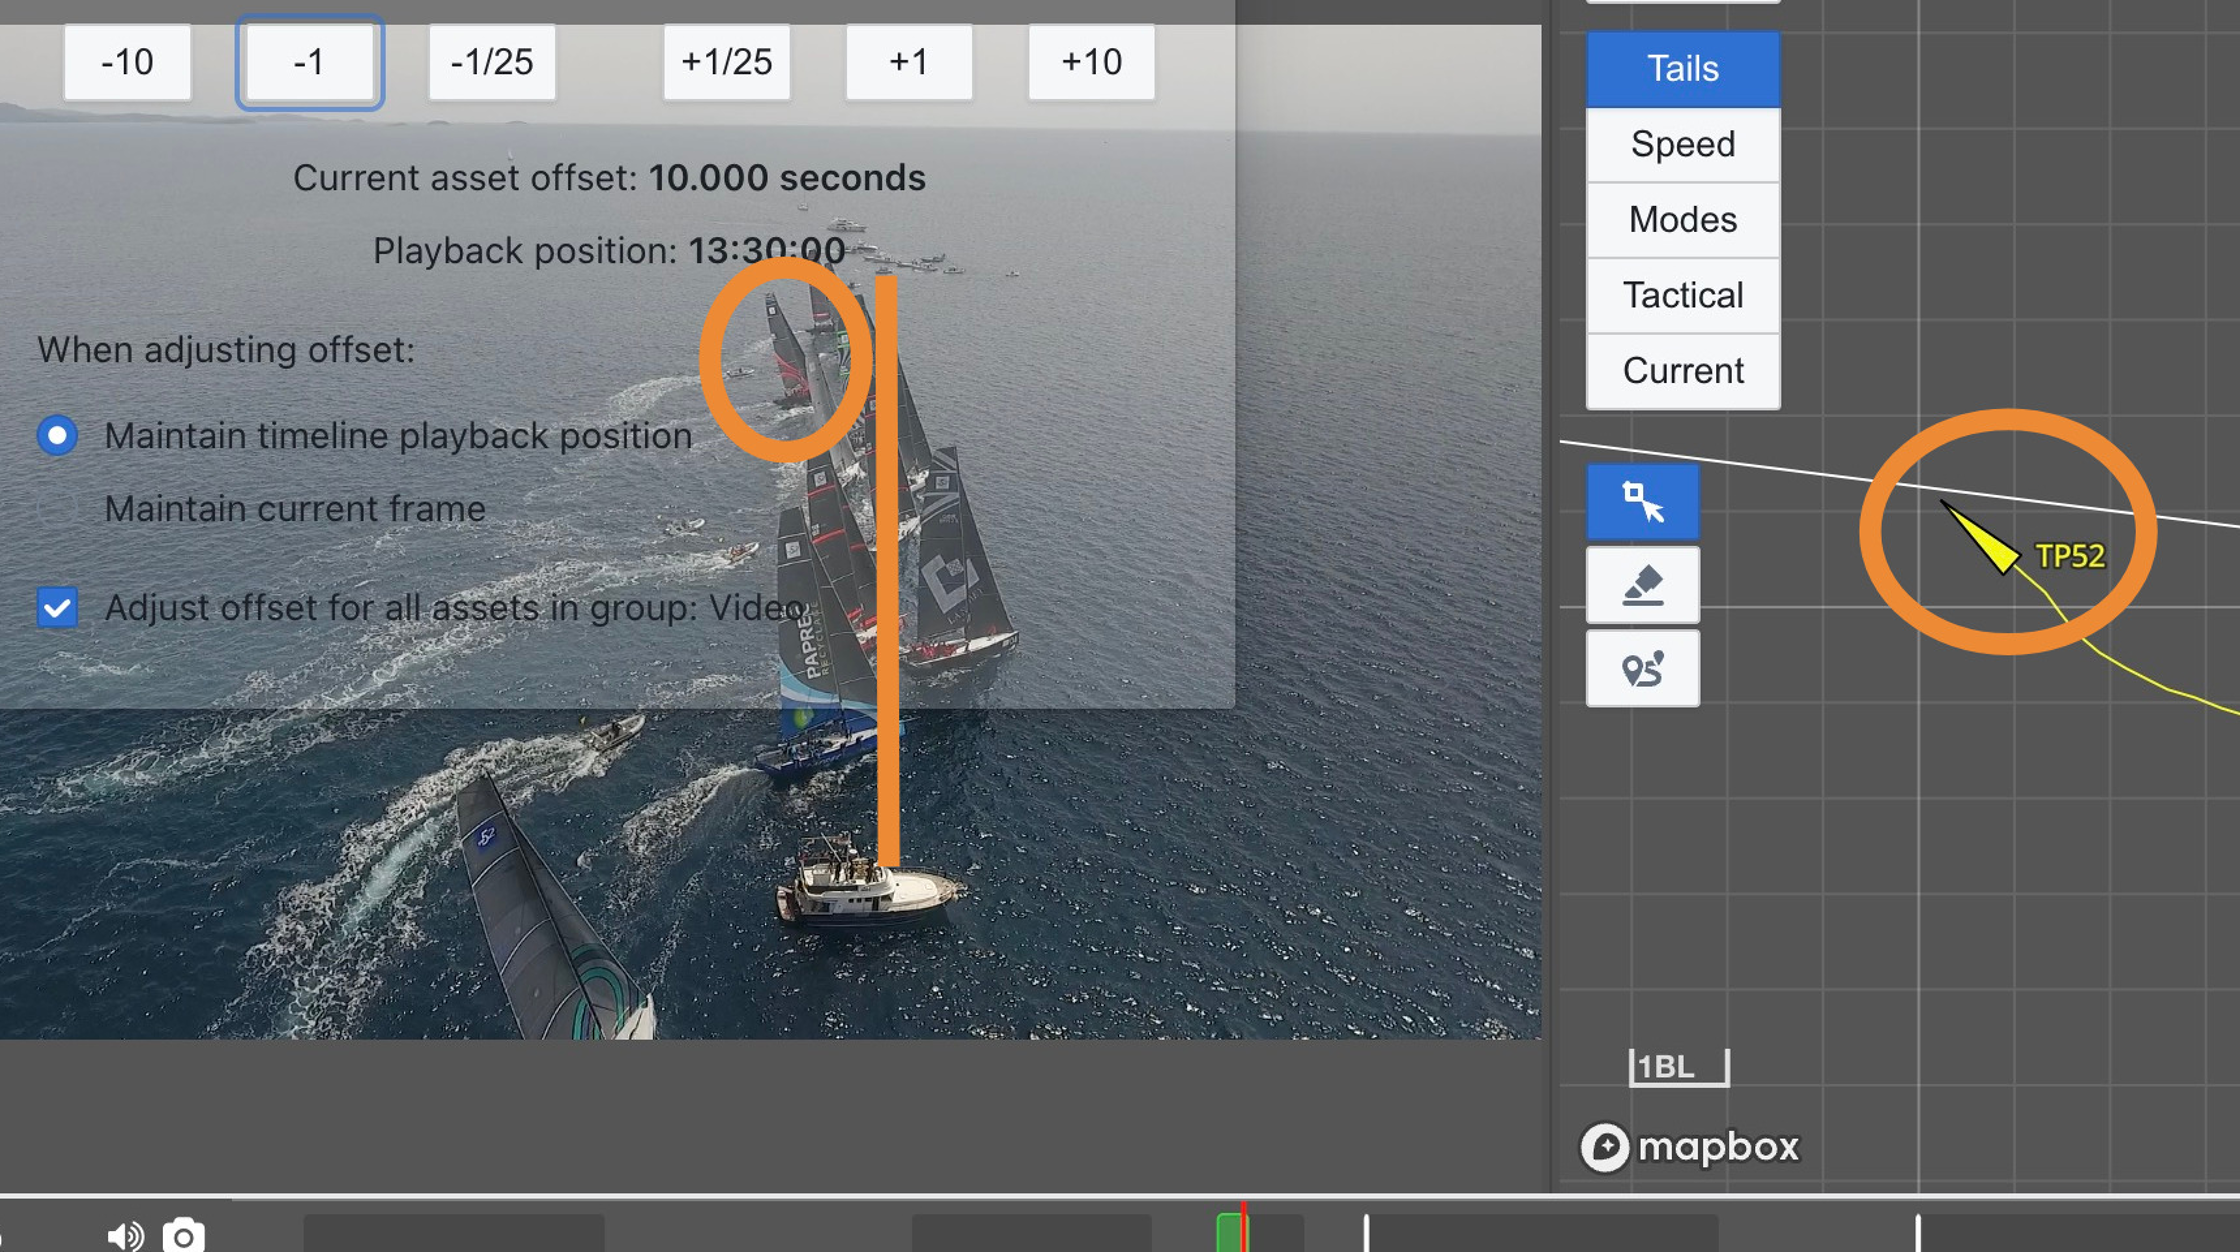
Step 14
As another example, here we have used the position of the boom and rudder visible in the video to synchronize with a turn up / tack visible in the boat's track.
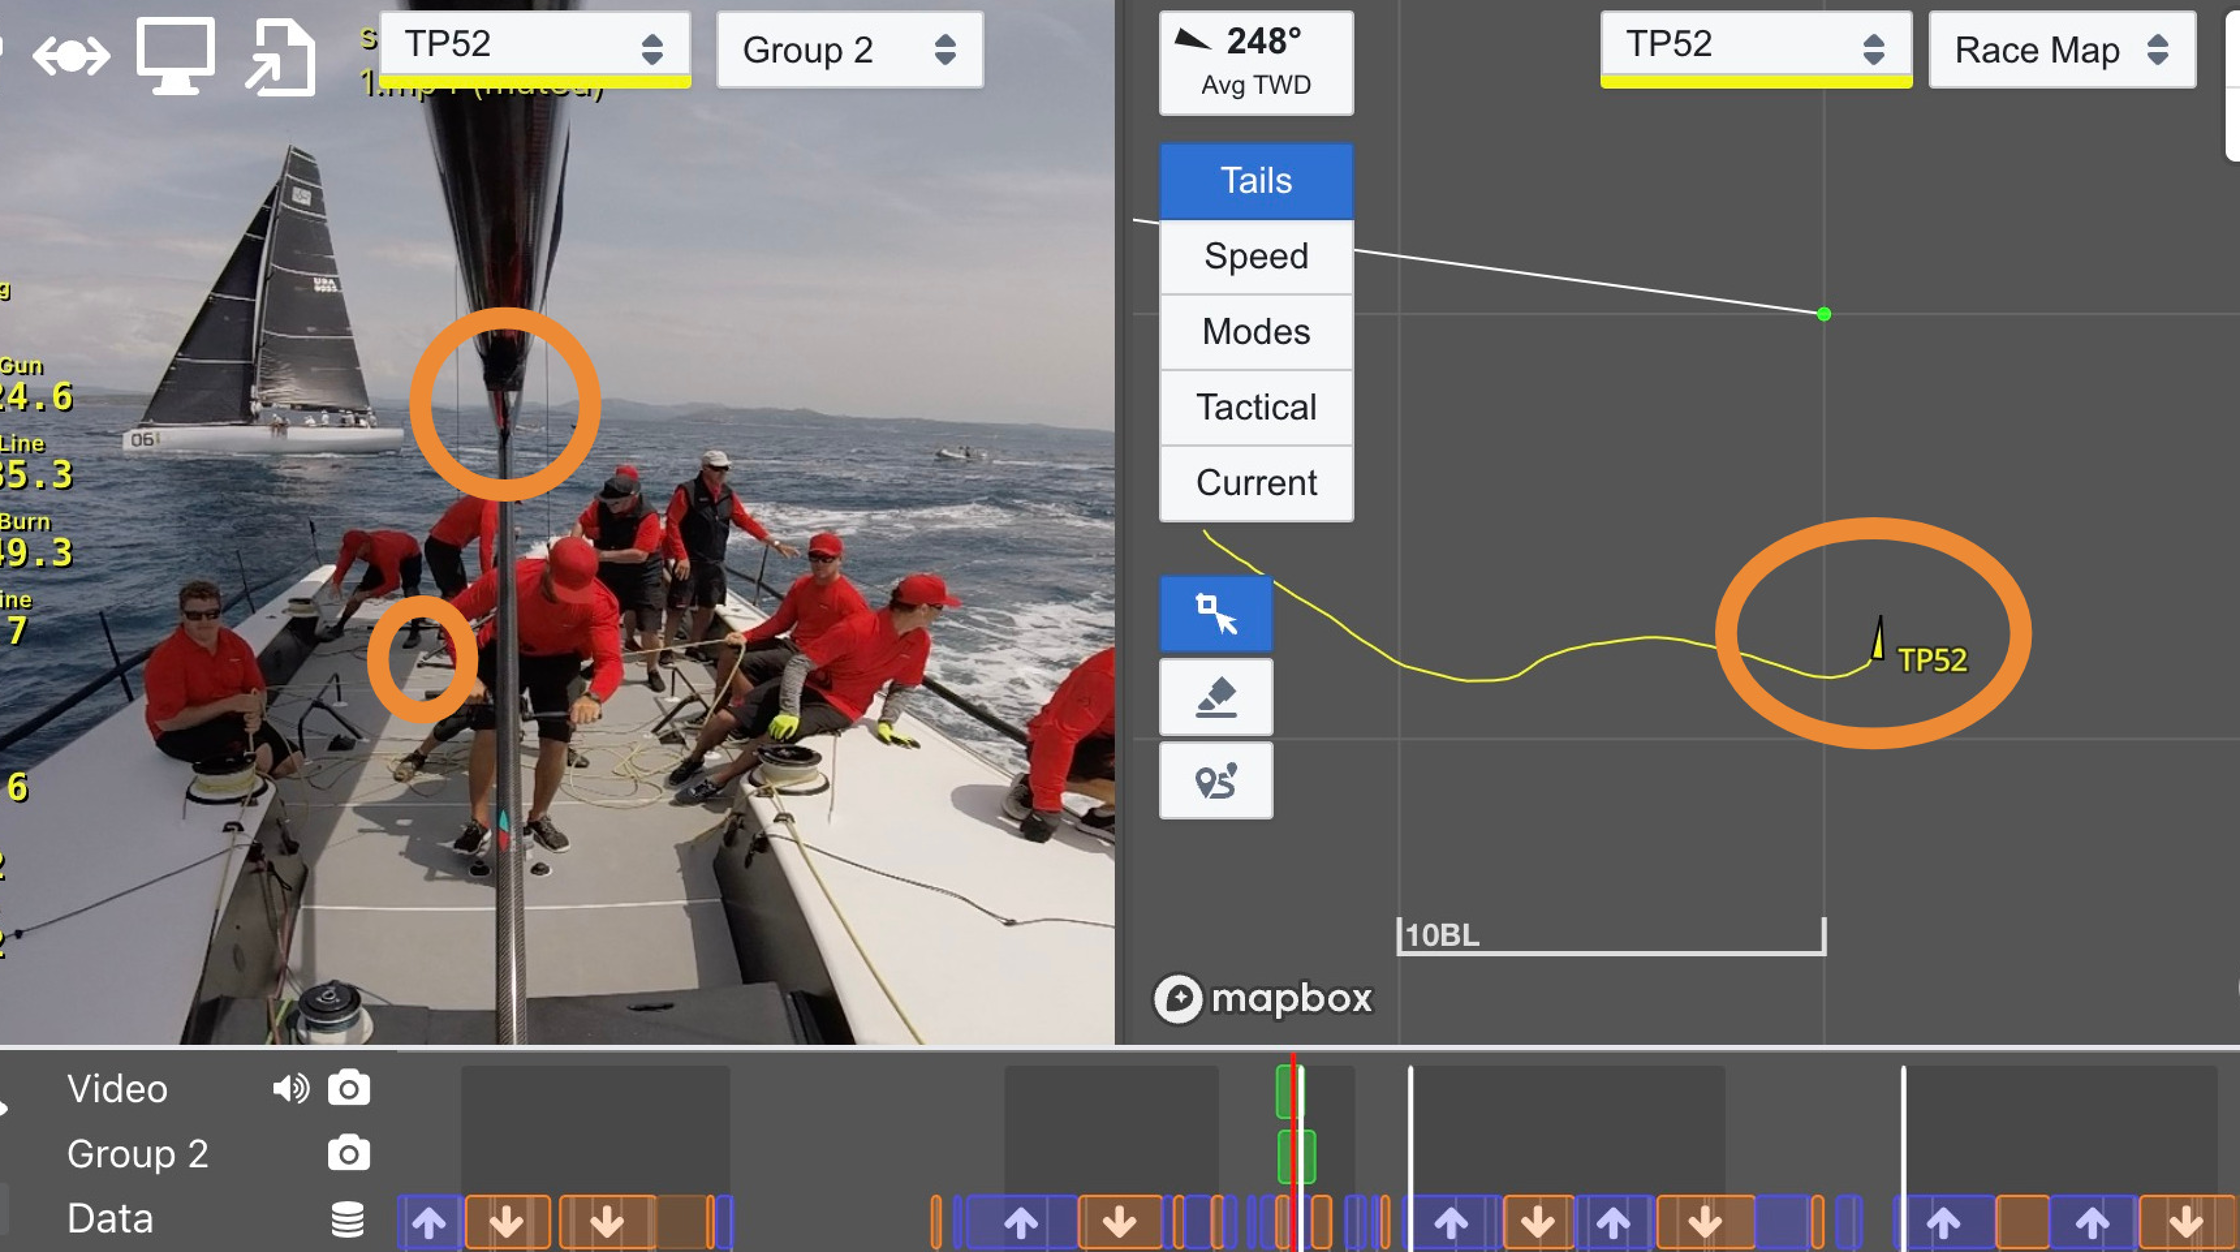
Locating Media Files
When opening a Njord Player document and media files (videos / photos) are no longer in their original location, the affected files wil show up in red in the timeline, and cannot be played. Click Locate Files… and select the directory where the files are now located. File names must be identical to what they were when adding the file to Njord Player, otherwise re-association is not possible.
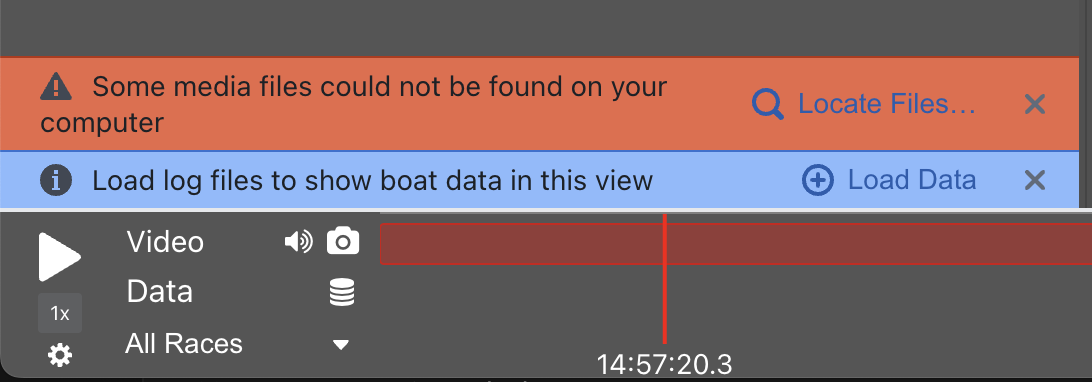
Supported Media Formats
Video
Formats: MP4, MOV
The file timestamp is taken from the capture date recorded in the video file (falls back to file creation date if unavailable).
When recording video using DJI drones, it is recommended to enable the Video Caption option and retain the generated .SRT files. These files will allow the Njord Player app to accurately detect file timestamp offsets that may be present in DJI video files.
When using newer GoPro models and GPS is turned on, the GPS based time stamp source GPS Time (GoPro GPMF) will be selected automatically — this gives the most accurate alignment with no manual adjustment needed. When GPS is off, make sure the GoPro time is set correctly before the recording and select time stamp source QuickTime Time Code = Start of video in Njord Player to make consecutive clips align correctly.
Tip: Always load video files with their original camera filenames. Njord extracts timestamps from filename patterns — renaming files before loading may prevent correct automatic timestamp detection.
SailGP-produced video (world feed, umpire, onboard cameras) does not contain reliable internal timestamps. For these files, set Time Source to Custom Timestamp, use the TV broadcast start time for that day minus approximately 33 seconds as the starting offset, and fine-tune using the Precise Time Adjustment steps above.
Njord Player supports MP4 files using the AVC/H.264 codec or the HEVC/H.265 codec. Since Njord Player version 2.4.0, HEVC/H.265 playback uses hardware acceleration and requires one of the following graphics cards:
- NVIDIA GTX950 and above
- AMD RX460 and above
- Intel HD4400, HD515 and above
- AMD Radeon R7, Vega M and above
- Apple M1, M1 Pro, M1 Max, M1 Ultra and above
Detailed list of hardware support: Intel, AMD and NVIDIA.
HDR video is supported by Njord Player since version 2.4.0.
If your machine does not have a supported GPU for HEVC, playback may fail. In that case, open the same session in Njord Web Player using Chrome, Edge, or Safari — the system browser typically has better HEVC codec support.
360 Video Compatibility
Njord Player supports 360 video and allows dragging/panning the video using your mouse when paused and during playback. This requires the entire sphere to be projected onto a single rectangular (equirectangular) video stream. Cameras that store the sphere as multiple streams, or in a proprietary container, are not directly supported — in that case, use the camera vendor's desktop tool to export an equirectangular MP4 (or a flat section of the sphere as a standard MP4), then load the exported file into Njord Player.
| Camera | 360 mode in Njord Player |
|---|---|
| Garmin VIRB 360 | Supported |
| Insta360 X5 | Supported |
| Insta360 (earlier models) | Not supported (encodes two semi-sphere streams) |
| GoPro Max, GoPro Fusion | Not supported (proprietary container) |
| DJI Osmo 360 | Not supported (encodes two semi-sphere streams) |
If you have a 360 camera not listed here, contact support so we can check compatibility and add it to this list.
Photo
Formats: JPG, PNG
The file timestamp is taken from the photo capture date recorded in the file's EXIF tags (falls back to file creation date if unavailable).
Audio
Formats: MP3, M4A/AAC, WAV/PCM, Ogg Vorbis, FLAC
The file timestamp is taken from the file creation date.
Note: Each media track has its own independent time offset. Adjusting the timestamp on a video file does not affect a separately loaded audio file (e.g. an onboard microphone recording). Adjust each track independently using the same steps above.
Media Timestamp from File Name
If the file name of any video, photo or audio file contains a timestamp in the form YYYY-MM-DD_hh-mm-ss or YYYYMMDD_hhmmss or YYYYMMDDhhmmss, this timestamp is used. Other timestamps (above) are still available to be selected manually. This may be useful when generating assets outside of typical recording devices / cameras.
In any of the timestamp formats above, you can optionally append 1 to 3 extra digits after the 2 "seconds" digits for sub-second precision (e.g. YYYY-MM-DD_hh-mm-sss for 1 fractional second digit). Do not use a decimal point. 1 extra digit indicates tenths of a second, 2 digits hundreds, 3 digits thousands.
Multi-Window and Multi-Screen
Njord Player supports any number of open windows simultaneously, all synchronised to the same playback time. Seeking or playing in any window updates all others instantly.
Opening a new window
Desktop app:
- Click the new window icon in the toolbar of any media or chart view
- From the menu bar: Window → New Window
Web Player:
- Click the new window icon in the toolbar of any media or chart view
- New Window button in the top toolbar
Note: multi-window media playback in Web Player works best in Chrome, Edge, or Safari. Firefox does not support media in secondary windows.
Each new window can show a different view type and can be moved to any connected screen.
Window types
- Media view — video playback with configurable data overlays
- Map view — race track with tactical colouring and measurement tools
- Line chart view — rolling strip chart of selected metrics, playing in real time alongside video
Typical setups
| Screens | Common layout |
|---|---|
| Laptop only | Main video + map or line chart side by side |
| Laptop + 1 external | Main video on external, map or line chart on laptop |
| Laptop + 2 external | Main video, secondary camera or map, line chart |
Some teams run 10 or more windows across multiple screens for full fleet and multi-camera presentations.
Tips
- The line chart window is useful alongside video to show metric trends as the race plays back.
- The map window shows competitor tracks and tactical colouring — useful when presenting strategic decisions to the team.
- Window layouts are saved with the
.sail2document.
Exporting Media with Data Overlays
Njord Player can export photos and video clips with data overlays baked in. Metrics are matched to the exact timestamp of each photo or video frame automatically.
Photo batch export
In the media list, select the photos you want to export (or select none to export all). A button labelled Batch Export N Photos with Metrics Overlay will appear below the list. Click it to open the export dialog, where you can choose which metrics appear on the exported images and the output image size.
Player processes all selected photos in one batch operation and saves the results to disk.
Tip: if photo timestamps are off (e.g. wrong time zone on the camera), adjust the time offset before exporting.
Video export
Select a single video in the media list. A button labelled Export [filename] with Metrics Overlay will appear below the list. Click it to open the export dialog, where you can configure:
- Metrics — which data channels appear as an overlay
- Time range — export the full video or a specific section
- Resolution — full, 50%, or 25%
- Quality — output bitrate
- Codec — available codecs are listed; hardware-accelerated options are indicated in the selection field
Codec support
Some videos may not export depending on your operating system and hardware. If export fails or a codec is not listed, try Njord Web Player — using the latest Chrome or Safari on macOS may unlock additional export options.
Sharing Njord Player Documents
Njord Player (both the Desktop Player App and Njord Web Player) works locally on your computer. Boat data or media files that you add to Njord Player are not automatically uploaded and are only available on your computer. This is different from Njord Analytics where data is uploaded and easily shared with others.
You can save your work in a Njord Player file to reopen that file on your computer and to share it (with limitiations, see below).
What's included in a Njord Player file (.sail2 file):
- Any boat data that you loaded
- Races, trainings and course information
- Comments
- A reference to, timestamp information, time adjustments and fallback source (see below) of each media file
- Window and view configurations
What's not included:
- The actual media files (for size reasons); when reopening the Njord Player document you have the option to re-link the original files if they have moved or when opening the Njord Player document on another computer
When sharing a Njord Player file with others, the question therefore arises how to make media files available together with the Njord Player file so that both data and media can be played back on another computer. Different methods are possible, each with pros and cons.
Using External Hard Drives
After copying the Njord Player file and media files onto an external hard drive, you can open that Njord Player file on any computer just by plugging in the drive. The Njord Player file or media files do not need to be copied to the internal hard drive to be used.
This option works well with very large media sizes and/or limited internet connectivity. It often requires one hard drive per person to share data with.
Using Online Storage Services
After uploading the Njord Player file and media files into a shared drive (e.g. Dropbox, Google Drive, or others), all files will need to be downloaded to the destination computer before they can be used.
This option works well with limited media sizes and requires a potentially lengthy upload and download process.
Using Online Media
After adding a media file in the media group's file list, you have an option to enter a fallback source for that media file in case the Njord Player document is opened on a computer that does not have the original media file available (Play if local file not available). A fallback source can be:
- A URL (for video, photo, or audio files); in most cases this needs to be a publicly accessible
http://orhttps://URL that points directly to the actual file, links to files uploaded on Dropbox or Google Drive are not suitable - A Youtube ID (video files only); enter only the short ID (like
JuiyzGAMLZO) and not the full link to the video
You will need to upload each media file accordingly before entering that fallback information.
When sharing a Njord Player file whose media files are configured in this way, the Njord Player file can be transferred to other computers alone and opened there. Media will play from the online source instead of a local file.
This option works well with limited media sizes and requires a potentially lengthy upload process. However, the download process is easier than with the "Using Online Storage Services" method as media will automatically be downloaded on demand during playback.
Njord Web Player
Njord Web Player runs in any modern browser — no installation required. It works on Windows, Mac, iPad, and any other device with a supported browser, and is fully compatible with session files created in the Njord Player desktop app.
Analytics Mode
In Analytics Mode, Njord Web Player will display boat data and races as they appear in one Njord Analytics event. You can add media, but you cannot add more boat data.
To launch Njord Web Player in Analytics Mode:
- Visit an event and date of your choice in Njord Analytics
- Click on Njord Player
- Select Open in Njord Web Player
Njord Web Player displays data loaded into Njord Analytics only. At the moment, there is no extra charge for using Njord Web Player, but you will need to load data into Njord Analytics.
You can switch from Analytics Mode to Document Mode (see below), at which point data is downloaded from Njord Analytics.
Document Mode
This mode is most similar to Njord Player (desktop app). In Document Mode, Njord Web Player displays boat data that has been loaded locally in your browser. Any data that you load is stored locally and not uploaded to Njord Analytics.
To launch Njord Web Player in Document Mode, visit https://app.sailnjord.com/player/
Loading data in Njord Web Player incurs the same fees as loading data in Njord Player.
Loading and Saving files
You can save the boat data, races and references to media as a .sail2 file. Njord Web Player files are compatible with Njord Player (desktop app) and vice versa. Saving works in either Analytics Mode or Document Mode.
Njord Web Player Unique Features
- Can be launched very quickly, does not require app download + installation
- Runs in a browser of your choice (among other things, the choice of browser impacts video playback capabilities and performance, and video export capabilities)
Njord Player (desktop app) Unique Features
- Supports loading data without an internet connection
Online Mode
The Njord Player App supports two modes: bundled mode and online mode. The window title bar indicates which mode you are currently using.
Bundled Mode
Bundled mode is the default mode. Switch back to Bundled Mode from Online Mode by selecting Use bundled version from the Njord Player menu.
- Works offline (after an initial start with internet connection to load your boat and license information)
- Application features are tied to the Njord Player version you downloaded and not automatically upgraded
- Upgrade Njord Player by downloading the latest version from https://www.sailnjord.com/help/player-changelog/
Online Mode
Switch to Online Mode by selecting Use online version from the Njord Player menu.
- Faster access to new app functionality and bug fixes
- Upgrades automatically (may need to press Ctrl/Cmd-R to reload)
- Is it still advisable to use the latest version from https://www.sailnjord.com/help/player-changelog/ to ensure best compatibility
We may ask you to switch to online mode when you encounter problems and we solve those for you with a bug fix, online mode is a way for you to before the next Njord Player App version is released. You may switch back to bundled mode once the next Njord Player App version has been released.
Frequently Asked Questions
Does Njord Player support 360 degree-type video?
Yes, 360 degree video is supported since Njord Player version 2.3.0. Support depends on the camera — see the 360 Video Compatibility table for the current list.
Do you have a suggestion for a dictaphone, preferably with GPS for time stamping?
Phones (e.g. the iPhone Voice Recorder app) work great as a dictaphone because the timestamps are usually accurate with no effort required.
Other dictaphones work too, but you might have to set the time each morning for it to be accurate.
In any case, it helps to do an audible time countdown at the beginning of the recording, so you can verify the correctness of the recorded timestamp after you load the file in Njord Player.
How do I switch off the dual view in the main window?
From the menu, select View - Window Layout - Single View.
How do I share video with performance data overlays?
Load a video and make sure its timestamp is adjusted properly (to ensure synchronization with your data). In the media list, select the desired video and click "Export".
See also: Exporting Media with Data Overlays
Does Njord Player run on iPad?
The original Njord Player app does not run on iPad. It runs on Windows and Mac. Find the right download link for your platform on our Njord Player page.
You can try Njord Web Player which runs in any browser, including the iPad's. It does not offer all capabilities of the Njord Player app yet.
I am moving video files off of my laptop onto a hard-drive (running out of space). Does this mean that Njord Player is now looking in the wrong place for the files? Do I have to re-import the media again?
We suggest to keep the Njord Player file (.sail2) in the same folder as your video. E.g., one folder per day usually works great. You can have sub-folders for video, but everything should be in the same top folder. You can then move that entire folder around and it's not going to be a problem for Njord Player.
See also: Sharing Player Sessions
My HEVC/H.265 video won't play in Njord Player
HEVC playback requires a compatible GPU — see the hardware list in Loading Media. If your machine doesn't meet the requirement, open the same session in Njord Web Player using Chrome, Edge, or Safari, which typically has better OS-level HEVC support.
My video and data are off by several hours — timezone issue?
This is almost always a timezone mismatch. Work through these steps:
- Make sure you load your boat log data before adding video — GPS-based timestamps in the log data set the event timezone automatically.
- In the media list, select the affected video files and check the Time Zone field — set it to the timezone where you were sailing.
- If the event timezone itself is wrong (e.g. after downloading from Analytics), check the Event Timezone setting in the Data pane and correct it before re-adding video.
See also: Loading Media
My GoPro video is off by a few minutes — how do I fix it?
If your GoPro had GPS enabled, Player selects the GPS-based timestamp automatically and alignment should be accurate. If GPS was off, the GoPro clock must have been set correctly before sailing — select QuickTime Time Code = Start of video as the Time Source and use the Precise Time Adjustment steps to fine-tune.
See also: Loading Media
Njord Player seems to have a bug — what should I do?
First, make sure you are running the latest version of Njord Player — many issues are resolved in recent releases. Download the latest from sailnjord.com/player.
If the issue persists, try switching to Online Mode via the Njord Player menu → Use online version (then press Ctrl/Cmd-R to reload). Online Mode always runs the latest code and is the fastest way to access fixes that haven't yet shipped in a bundled release. The title bar will change from "Bundled" to "Online" to confirm the switch.
If neither helps, contact support at sailnjord.com/support.
OnboardAssistant Mobile App Integration
SailingPerformance OnboardAssistant Mobile App (OBA) is a mobile app for logging sailing sessions — sail changes, race marks, comments, GPS tracks, and audio / video / photos attached to events. Once you link your Njord boat to your OBA boat, you can pull all of these straight into Njord Analytics uploads and Njord Player documents without exporting and re-importing files.
What this gets you
- OBA events into Analytics uploads. Sail changes, race start / mark / finish, and free-form comments arrive on the timeline alongside your boat's instrument data.
- OBA GPS into Analytics uploads. Useful if you record your track only on OBA (no separate instrument log on board).
- OBA events and GPS into Njord Player documents. Same data, but loaded directly into a Player session — no Analytics upload needed.
- OBA media into Njord Player media groups. Photos, videos, and audio attached to OBA events go straight onto Player's timeline at the right moments.
Linking a boat
You link a Njord boat to an OBA boat once. After that all the integrations below "just work" — both Analytics and Player share the link.
- In Njord Analytics, open the boat and go to Settings → Integrations.
- Click Link to OnboardAssistant.
- Enter the email and password of the OBA account that owns the boat.
- Pick which OBA boat to link to (if your OBA account has more than one).
- Done. The Integrations tab now shows the linked boat and which OBA account it's connected to.
You need to be a manager of the Njord boat to link or unlink. Other team members benefit automatically.
Adding OBA data to an Analytics upload
When OBA recorded the same session your instruments did, you can attach the OBA events (and optionally the GPS track) to your Analytics upload in one click.
- Open the upload form for your boat (Data → Upload).
- Drag in your boat's log file as usual.
- Click Add from OnboardAssistant in the upload form toolbar.
- Pick the session you want to import. Sessions whose dates overlap with the log file you just added float to the top of the list.
- Choose whether you want Events (sail changes / race marks / comments), the GPS track, or both. If the session has GPS but your log file already covers the same period, GPS is unchecked by default — usually you don't want two GPS sources in one upload. Override if your OBA recording came from a coach boat or a separate device.
- Click Add events + GPS (or whichever combination you picked).
The events / GPS appear in the file list immediately and are processed alongside your log file. Process and load as usual.
Tip: You can run the dialog multiple times to pull events from several OBA sessions into one upload, e.g. if your day was split into several recordings.
Adding OBA data to a Player document
Njord Player offers the same flow at document creation time.
- Open the Data view in Player, pick the boat you want to add data for.
- Click Add from OnboardAssistant in the toolbar.
- Pick a session and choose Events / GPS as in Analytics.
- The OBA events and GPS land in the file list and are processed locally by Player. Confirm and load.
Tip: This works in both Njord Player desktop and Njord Web Player.
Adding OBA media to a Player media group
If you took photos, recorded clips, or saved audio notes against events in OBA, you can pull them all into a Player media group in one go.
- In Player, open the media group you want to add files to (Media → New Media Group, or click an existing group).
- Click Add from OnboardAssistant in the media group toolbar.
- Pick the OBA session whose media you want.
- Tick the media files to download. Already-imported media is greyed out — you can run the picker again later without making duplicates.
- Click Download N files (…). Your browser asks where to save them — pick a folder on your computer (a "Njord Media" subfolder works well).
- The files download in parallel; progress bars show per-file status. Each completed file is added to the media group immediately, with its timestamp set to the moment of the OBA event it was attached to. You can cancel mid-flight and keep whatever finished.
Where to save the files is up to you — Njord doesn't move or copy them again. Pick a folder you'll keep around.
Note: Media download is supported in Njord Player desktop, and in Njord Web Player on Chrome, Edge, and Brave. If you don't see the Add from OnboardAssistant button in a media group on Firefox or Safari, switch browsers for this step.
After reloading the document
Njord Player remembers the folder you picked. The next time you open the document, your browser will ask for permission to access that folder again — confirm once, and all your OBA-downloaded media plays as expected.
If you move or rename the files, or dismiss the permission prompt, the assets will show up as missing. Use Locate missing assets… to point Player at the new location.
Re-linking after a password change
If you change your OnboardAssistant password (or the connection is otherwise revoked OBA-side), Njord can't keep the link alive. The Integrations tab shows a warning, and the Add from OnboardAssistant buttons stop working until you re-link.
- Open Settings → Integrations on the affected boat.
- Click Re-link….
- Enter your new credentials. Pick the same OBA boat as before (or a different one, if you've moved boats).
You can also do this from Player: if Player ever shows the "OnboardAssistant needs re-linking" message, click the link to jump back to Analytics' Integrations tab.
Unlinking
To disconnect a Njord boat from OnboardAssistant:
- Settings → Integrations → Unlink.
Any data you've already imported into Njord stays put — unlinking only removes the connection, not the imported events / GPS / media.
Limitations
- Sessions must be uploaded to the OnboardAssistant cloud before Njord can read them. In the OBA app, end the session and upload it as usual.
- Media download in Player is supported on the desktop app and in Njord Web Player on Chrome, Edge, and Brave. Not available on Firefox or Safari.
Setting up a paid license for a boat
Explains how to set up payment details for a boat to continue loading data after the free trial period.
For an overview of latest prices, see https://www.sailnjord.com/pricing/
Understanding your options
A license covers one or more boats and one or more products. The checkout form calculates the exact price as you make selections.
Products
Choose one or more of:
- Njord Analytics — web-based performance analysis, includes Web Player
- Njord Player — desktop app for video debriefing
- Analytics + Player bundle — both products at a discount
Boats and fleet pricing
Boats are priced by class. Adding multiple boats to a single license costs less per boat than buying separate licenses (volume discount). A single license can cover boats from different classes — the price for each class is calculated separately and summed.
If you don't know exactly which boats to include yet, you can check out with placeholders (boat class + quantity) and assign specific boats after checkout.
Payment schedule
The checkout form shows four options and calculates the exact crossover point between them for your specific selection:
| Option | How it works |
|---|---|
| Pay per use | No upfront charge. You're billed per sailing day (by log data date), 2–3 days after a big event or at the end of each month. Re-uploading the same day's data on the same license and boat record is not billed twice — in that case the upload screen shows a green "no additional cost" message instead of the price. The price and the license to be charged are shown before each upload; confirming the upload authorizes the charge. |
| Monthly subscription | Fixed monthly charge, billed on checkout. Auto-renews monthly. Reminder email 10 days before renewal. |
| Annual subscription | Fixed annual charge, billed on checkout. Auto-renews yearly. Reminder email 10 days before renewal. |
| Pay upfront for specific dates | Enter a start and end date. Njord finds the best combination of monthly and annual pricing for that period, adds a small discount, and bills the total upfront. No auto-renewal. |
Subscriptions start on the day of checkout and are not aligned to the calendar month or year.
Which to choose: Start by estimating how many sailing days you expect. As a rough guide, more than 6–8 days in a month makes a monthly license cheaper than pay-per-use; more than around 6 active months in a year makes an annual license cheaper than monthly. The checkout form shows the exact crossover for your selection.
Payment methods
Credit card is accepted for all options. EU customers can also use SEPA direct debit. For annual subscriptions and prepaid periods, bank transfer is available — select "Pay later / bank transfer" at checkout.
Multiple licenses
You can hold more than one license simultaneously — for example, an Analytics subscription combined with a pay-per-use Player license for occasional use.
Comparing data with another boat
If you want to analyse your own boat alongside another boat in your class, the right licensing setup depends on whether the boats are on the same account or owned by different teams. See Comparing Multiple Boats for the practical options.
Step 1
Navigate to https://app.sailnjord.com/data/
Step 2
Select the boat you would like to purchase a license for
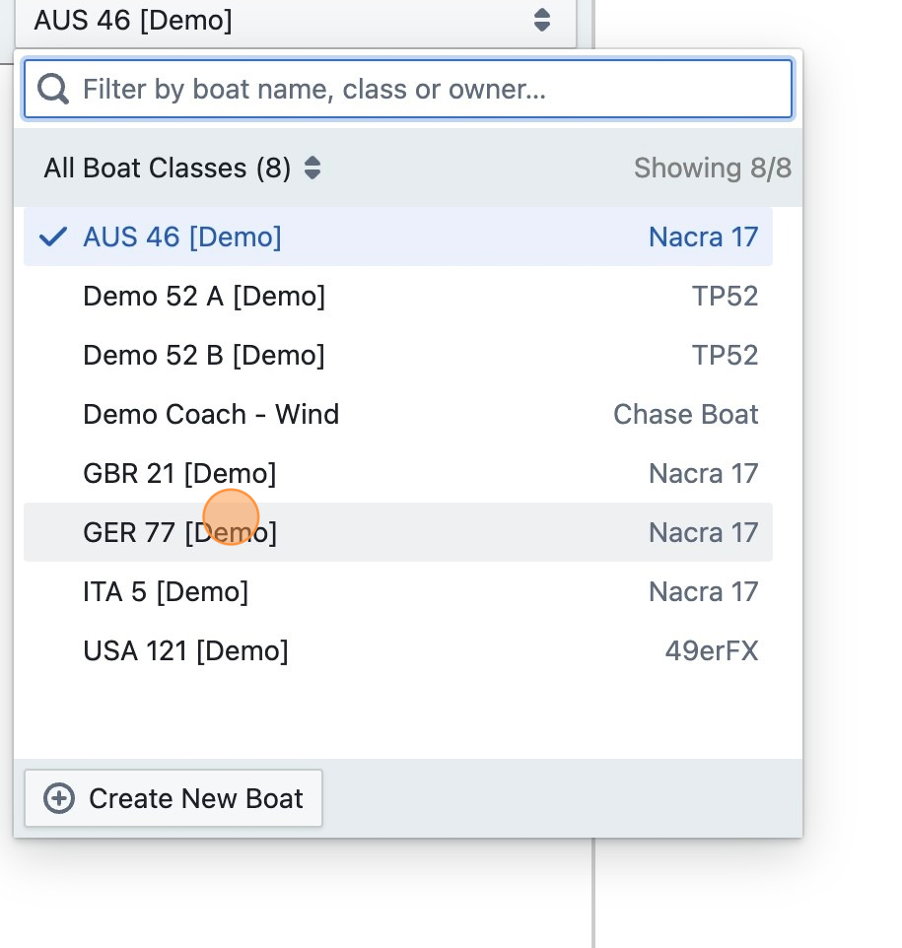
Step 3
Click "Settings"
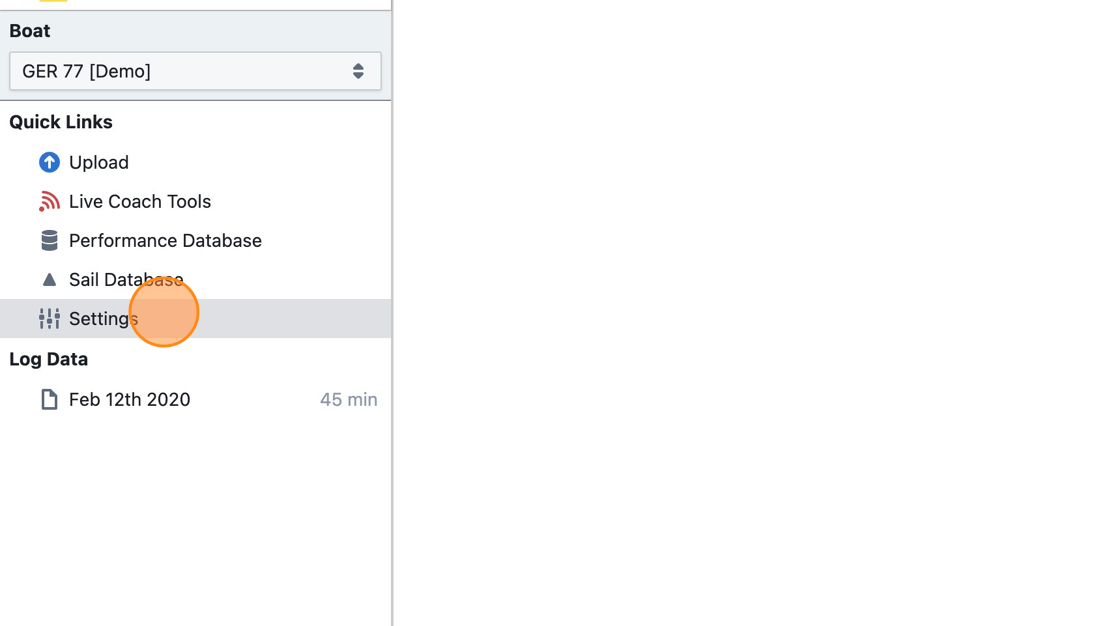
Step 4
Click "Licenses"
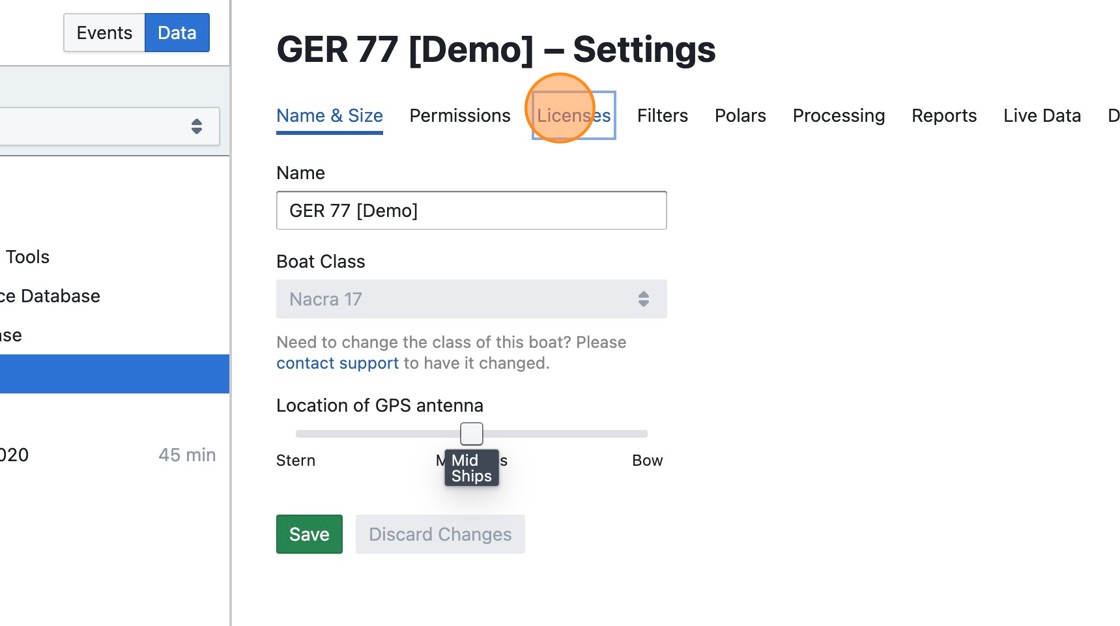
Step 5
Click "Add a Paid License"
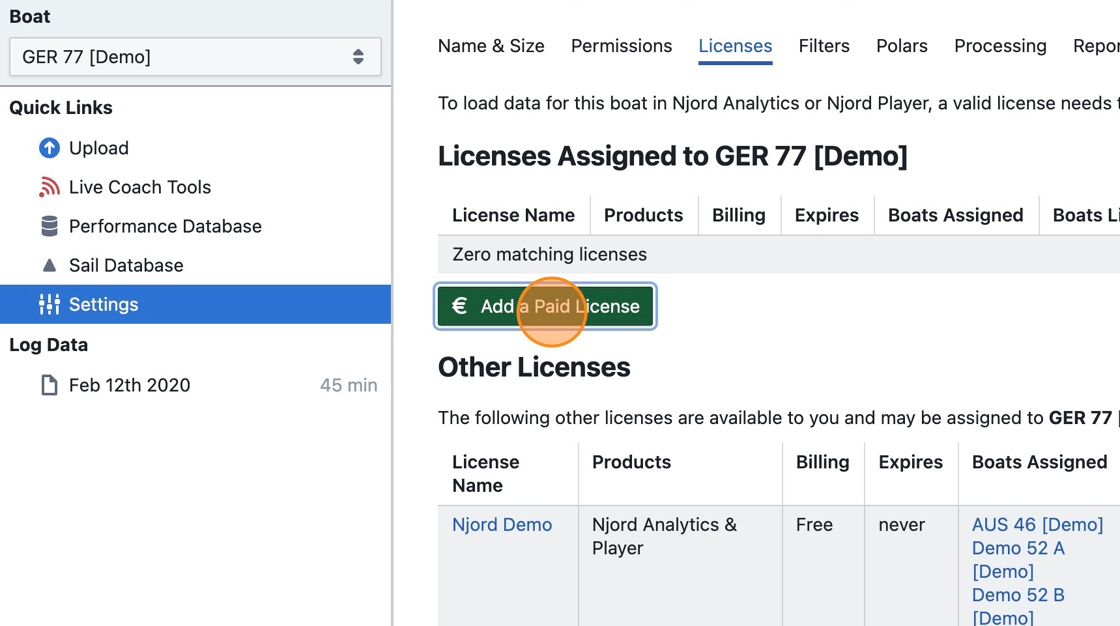
Step 6
Select the product(s) that you want to use (or deselect the ones you don't want to use)
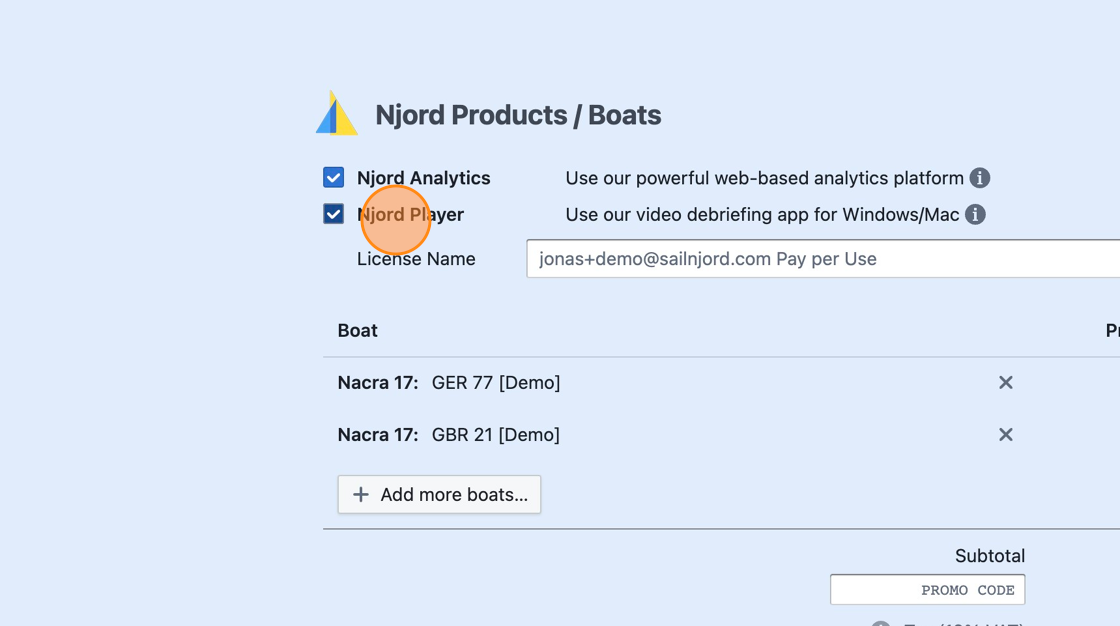
Step 7
Optional: Click "Add more boats…" to add more than one boat to the new license (volume pricing applies)
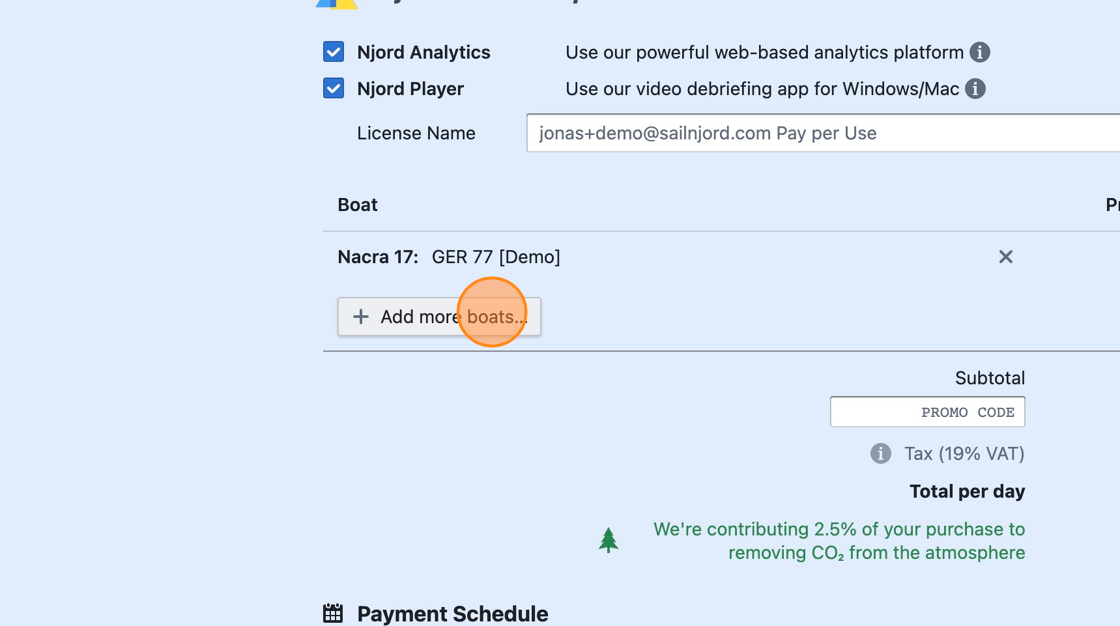
Step 8
Compare the daily prices (pay per use) or monthly / annual subscriptions to learn which price is best suited for the expected number of sailing days.
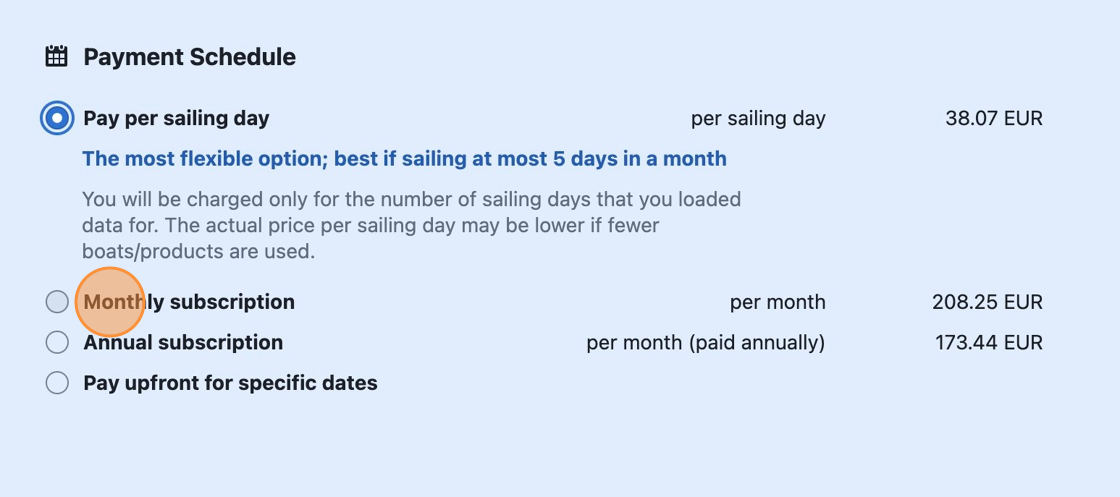
Step 9
If you know the dates of a specific event (or season) that you'd like to purchase a license for, click "Pay upfront for specific dates" and get the best price for those dates.
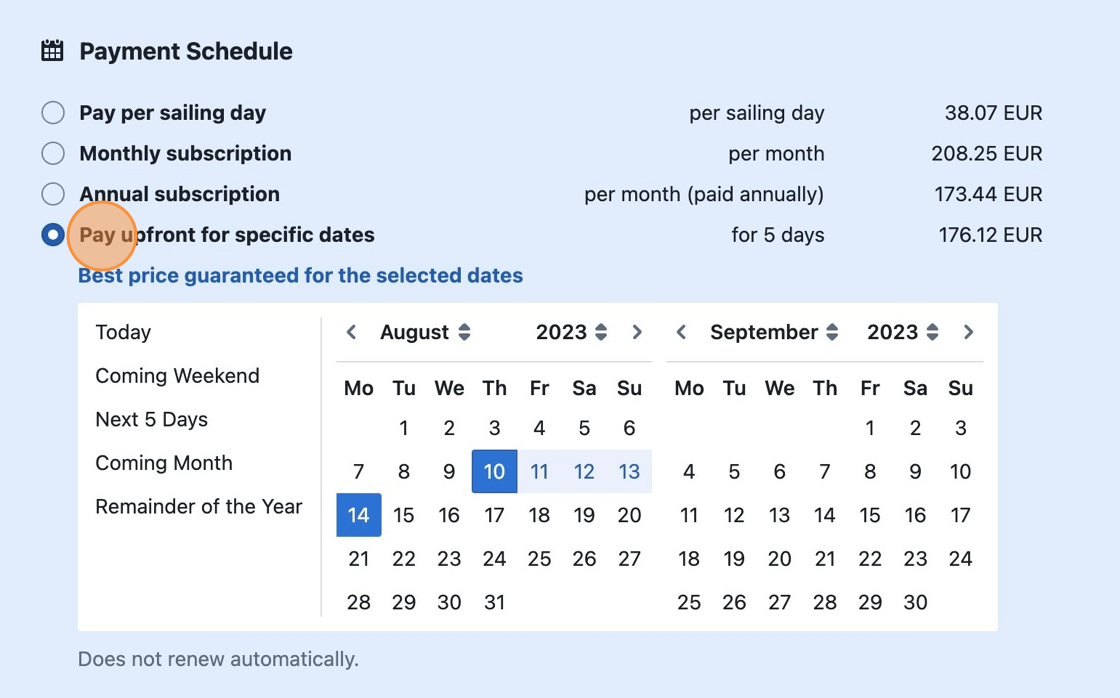
Step 10
Enter your billing and payment details.
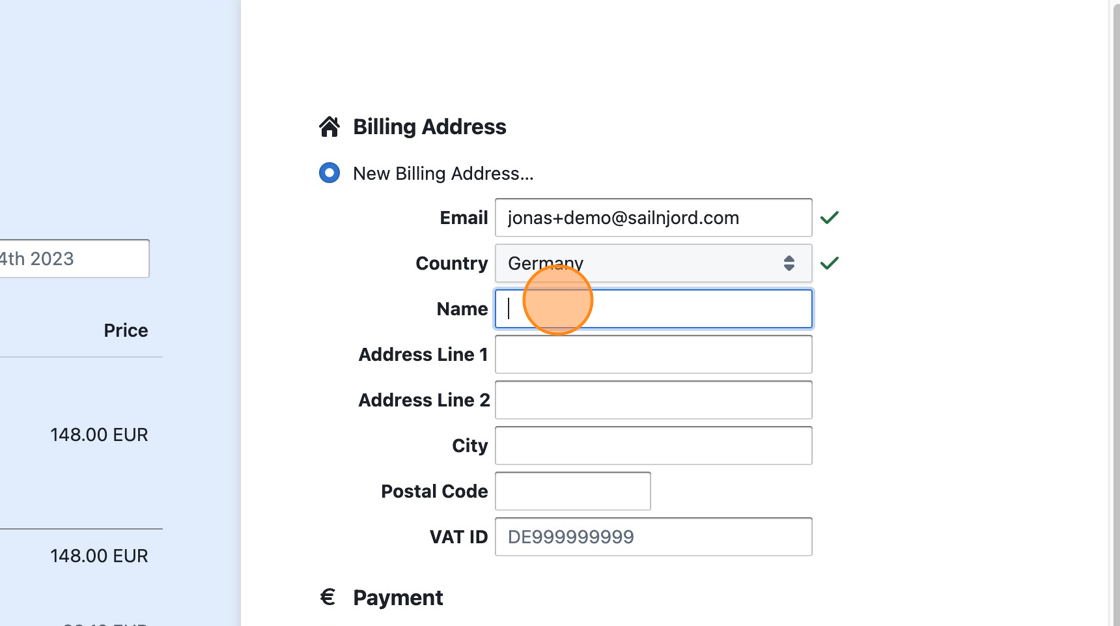
Step 11
Click the subscribe or pay button to complete the purchase. Your license will be ready to use immediately once the payment has been made.
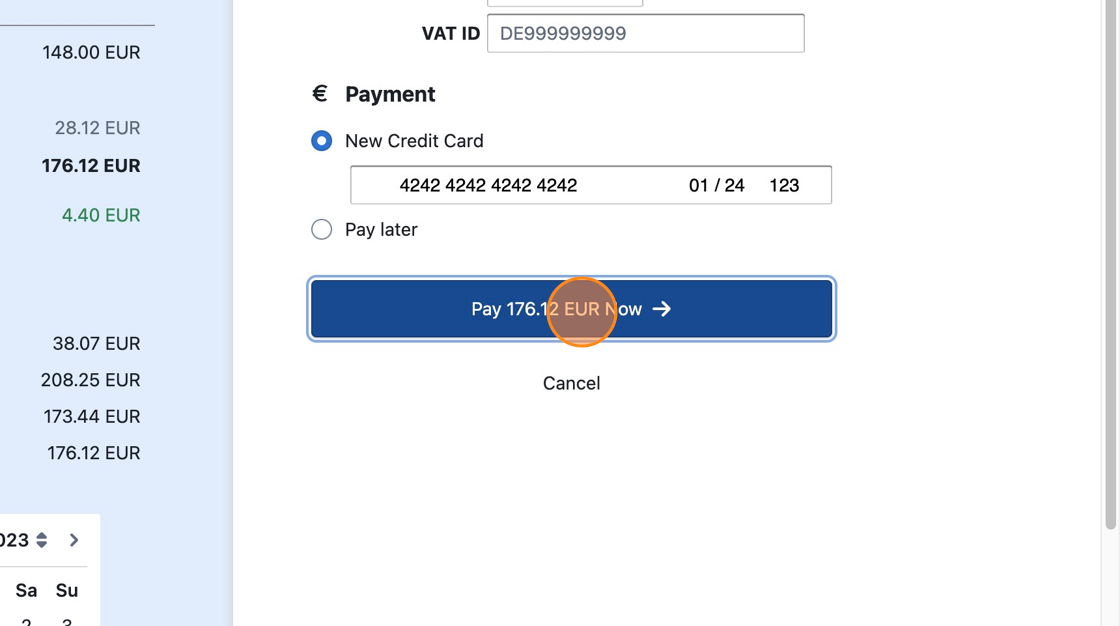
Helpful Resources
Below are some useful resources created by great sailors and coaches showing how to use Njord Player and Analytics along with related gear, recording devices, cameras etc.
Small Boats
"The Most Advanced Dinghy Tech Setup for 2025" by Tom Morris/Mozzy Sails
Big Boats
"Debriefing with Data Points - Feat. Quantum Racing's Cameron Appleton and Tom Burnham" by US Sailing
"Onboard Audio and Video Tips for Debriefing with Tom Burnham and Keith Brash" by US Sailing
Get Help with AI
You can use any AI assistant — ChatGPT, Claude, Gemini, or others — to answer questions about Njord. To get accurate, product-specific answers, give the AI access to the Njord knowledge base by sharing this link:
https://app.sailnjord.com/llms-full.txt
How to do it
-
Open your AI assistant of choice
-
Start a new conversation and paste something like:
Here is the Njord product knowledge base: https://app.sailnjord.com/llms-full.txt — please read it and then answer my questions about Njord.
-
Ask your question
Most modern AI assistants can read URLs directly. If yours cannot, open the link in your browser, copy the text, and paste it into the conversation instead.
What it covers
The knowledge base covers all Njord products — Analytics, Player, Live Tools, data formats, and more. It is updated alongside the product, so the AI's answers will reflect the current feature set rather than whatever it may have learned during training.