Targets

Available In Only Races, Aggregate all Dates in Event, individual races/trainings, Performance Database, Entire Day
Requires True wind speed (TWS) data
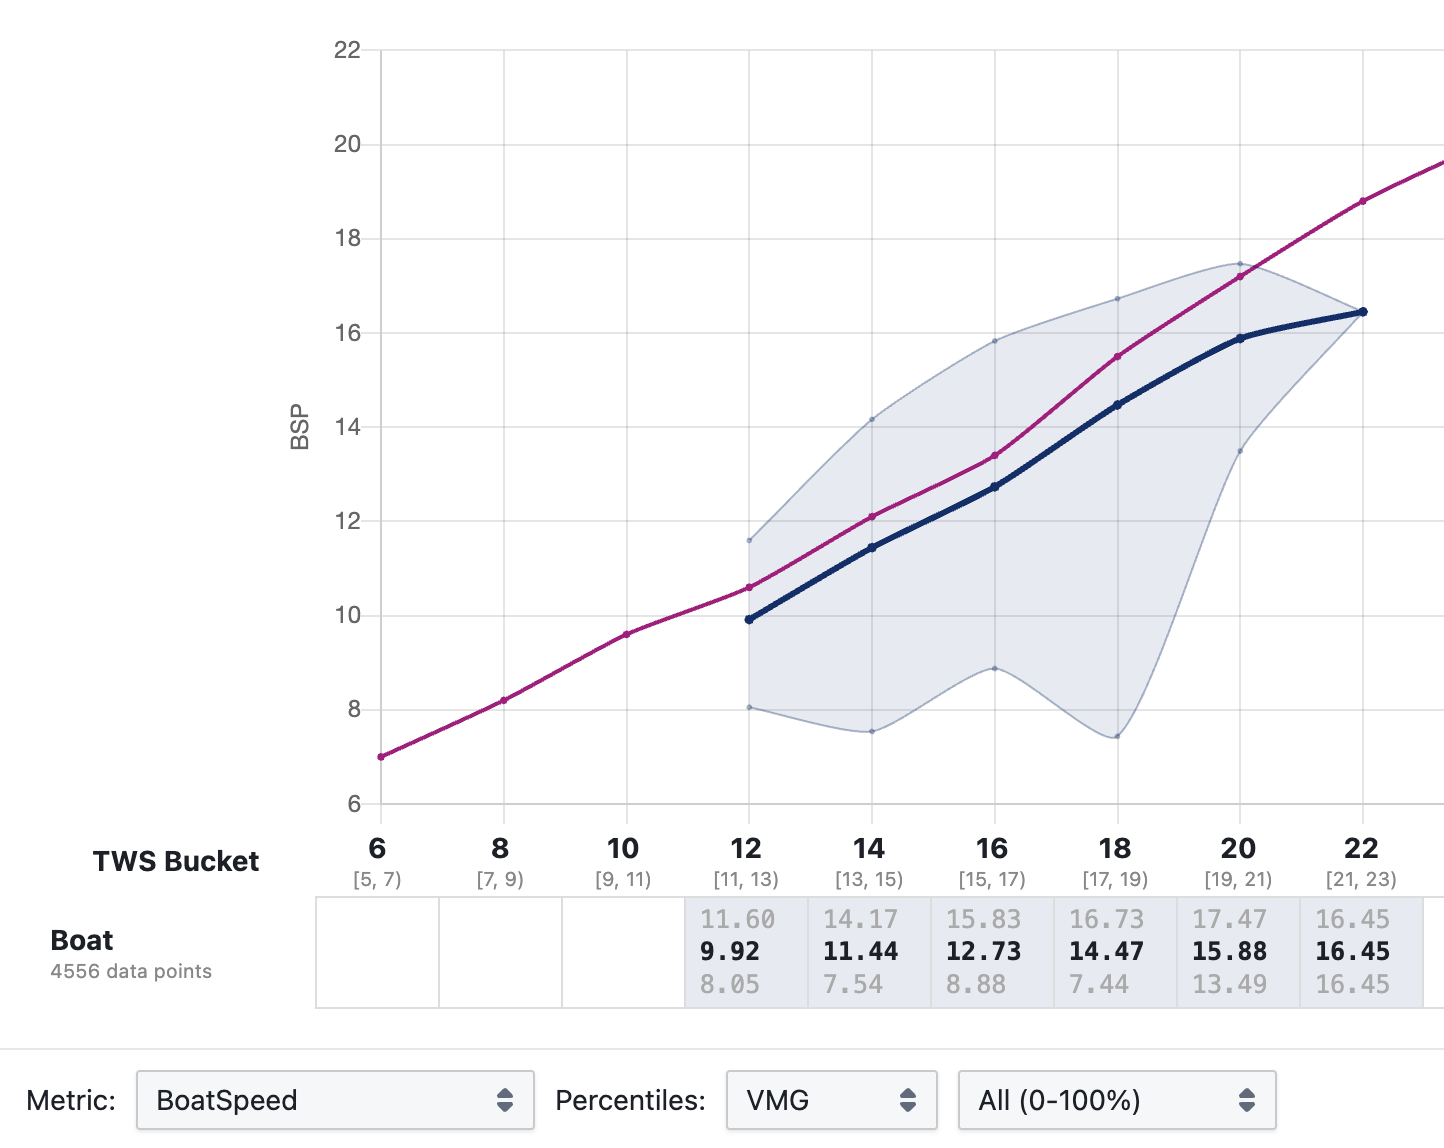
Compare your actual boatspeed and VMG against polar targets across wind speed ranges — the primary view for tracking performance trends over a race day or season.
Displays a selected metric (BoatSpeed by default) for upwind or downwind sailing, split into TWS buckets. The coloured band shows the min/max range across the dataset; a bold line shows the mean. When a polar is configured for the boat, target values appear as a separate reference line for direct comparison.
The bold line represents the average of that data, which may optionally be calculated only from a subset of data in each TWS bucket. For example, you could chose to average only the top 30% of data in each bucket by VMG, which would represent your "best data" and would be suitable to determine more "ambitious" targets for the selected performance metrics, compared to averaging all data in each TWS bucket (adjust the "Percentiles" setting).
Displays targets from configured polars for the selected boat as purple lines for comparison.
How data is processed
-
TWS bucketing — data points are grouped into TWS buckets with centre values at 6, 8, 10, … 30 knots. Bucket boundaries can be customised under Advanced Settings.
-
Ordering by Percentiles metric — within each bucket, data points are ranked by the Percentiles metric (VMG by default, since targets are optimised for upwind/downwind speed).
-
Percentile filtering — only data points within a selected percentile range are retained. The default preset ("high") keeps the 75th–95th percentile. The lower cutoff discards clearly poor sailing. The upper cutoff excludes momentary VMG spikes that are unlikely to be repeatable — this matters less when working with pre-aggregated data such as the Performance Database, so including up to the 100th percentile is perfectly reasonable there. A wider band (e.g. 75–95 rather than 90–95) retains more data points and produces a more stable average, which matters most for smaller datasets. The range also sets target aggressiveness: repeating 95th-percentile VMG is much more demanding than repeating 75th-percentile VMG, so the right choice depends on whether your team treats targets as aspirational numbers or as values that can be hit reliably.
-
Metric averaging — from the retained data points, the selected display metric (BoatSpeed, TWA_Abs, Heel, etc.) is averaged using an unweighted mean. This is the value shown as the bold line in the chart and in the table. The table also shows min/max values computed from the full dataset before percentile filtering.
-
Combined series — when multiple data series are shown simultaneously (e.g. in Performance Database mode), they are combined into a weighted average where larger series contribute proportionally more. This appears as the "Combined" series in black.
Configuration: what to change and why
Percentiles metric vs. display Metric
Step 3 (which data points are selected) and step 4 (which value is read from those points) are independent controls. The Percentiles metric determines the selection criterion; the display Metric determines what is averaged over the selected points.
For cockpit targets the correct setup is Percentiles: VMG with whatever Metric you need to read off. This selects the moments of highest upwind/downwind speed, then averages the chosen metric across those moments. To build a full targets table, keep Percentiles: VMG fixed and cycle through Metric: BoatSpeed, Metric: TWA_Abs, Metric: Heel, and so on. Each pass uses the same set of selected data points — only what is read from them changes.
Percentile range
The lower bound of the range (e.g. 75th) controls how much poor-performance data is discarded. Raising it reduces noise from bad tacks, lulls, or distracted sailing, but also reduces the number of data points available for averaging. The upper bound (e.g. 95th) controls how much of the very top is kept. Excluding the absolute top few percent removes momentary spikes that are unlikely to be repeatable in normal sailing — relevant for raw session data, less so for the Performance Database where data is already aggregated. Including up to the 100th percentile is reasonable when the underlying data is clean.
The range also determines target aggressiveness. A band centred around the 90th percentile produces numbers the team can hit on a good day; one centred around the 50th–75th produces numbers achievable more routinely. The right choice depends on how the team uses targets — as a stretch goal or as a reliable baseline.
This also explains why the chart numbers change when you change the Percentiles metric: you are changing step 3, which changes the subset of data points that reaches step 4, which changes every average regardless of which Metric is displayed.