Map

Available In Entire Day, Only Races, Aggregate all Dates in Event, individual races/trainings
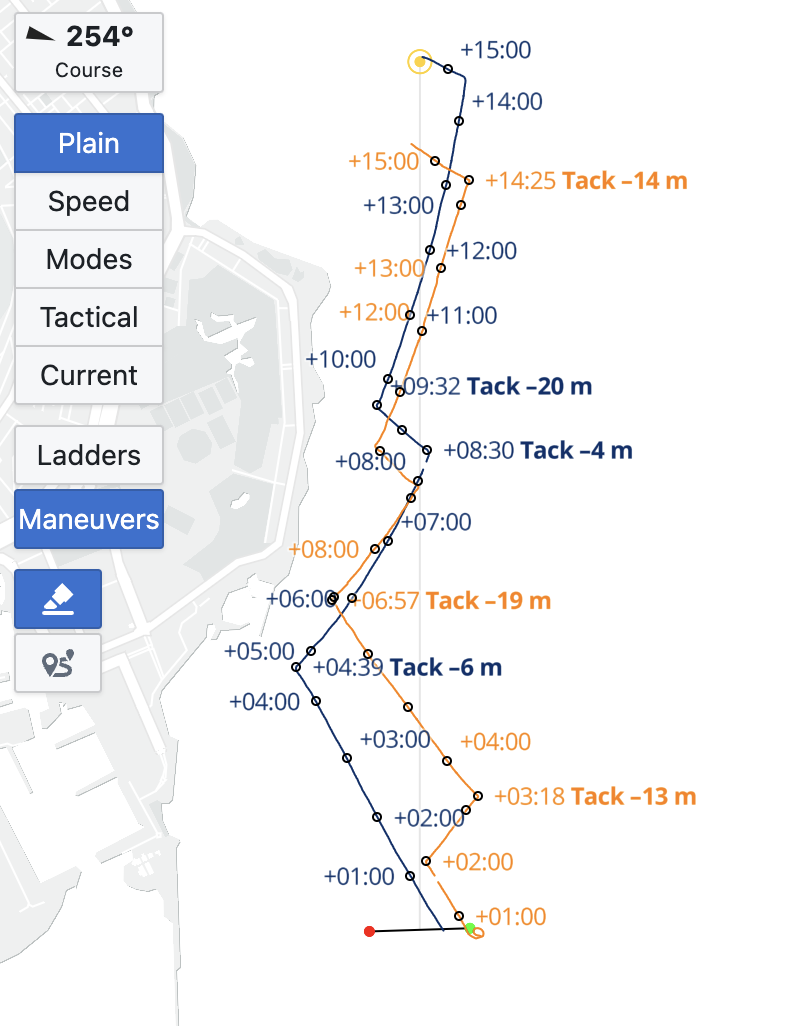
Shows the track of one or more selected boats and any marks of the race/leg on a map.
Use the highlight mode and click on a track twice to mark a time range. You can save this highlighted time range as a new training.
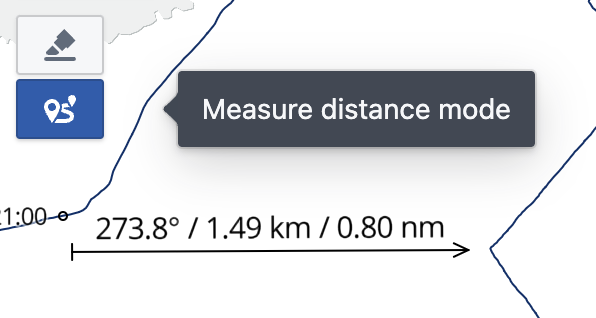
Use the distance measurement mode and click on the map twice to highlight and measure a distance and bearing.
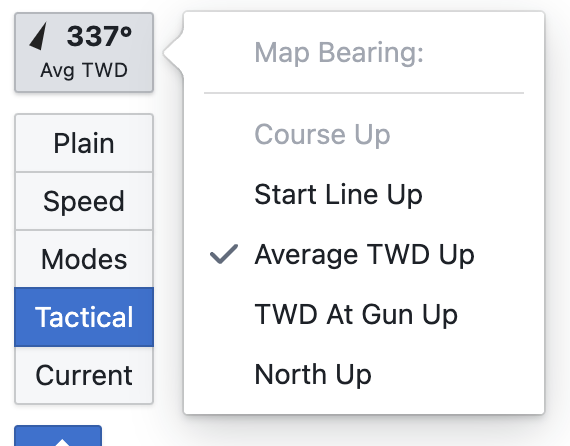
Click on the bearing control to select the "up" orientation of the map. Some options may not be available if either TWD data is missing or a race course has not been entered.
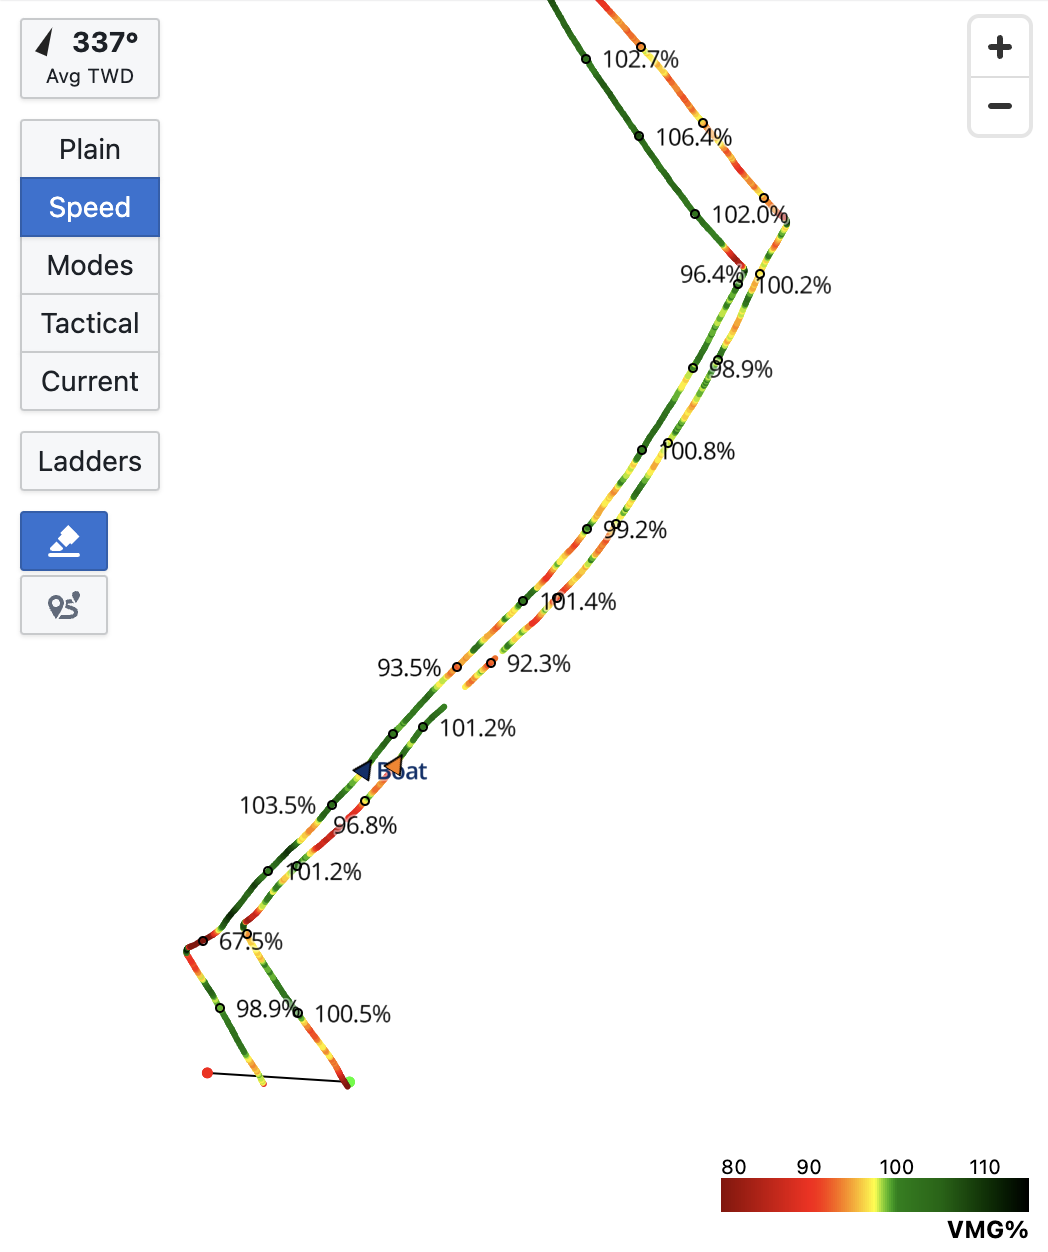
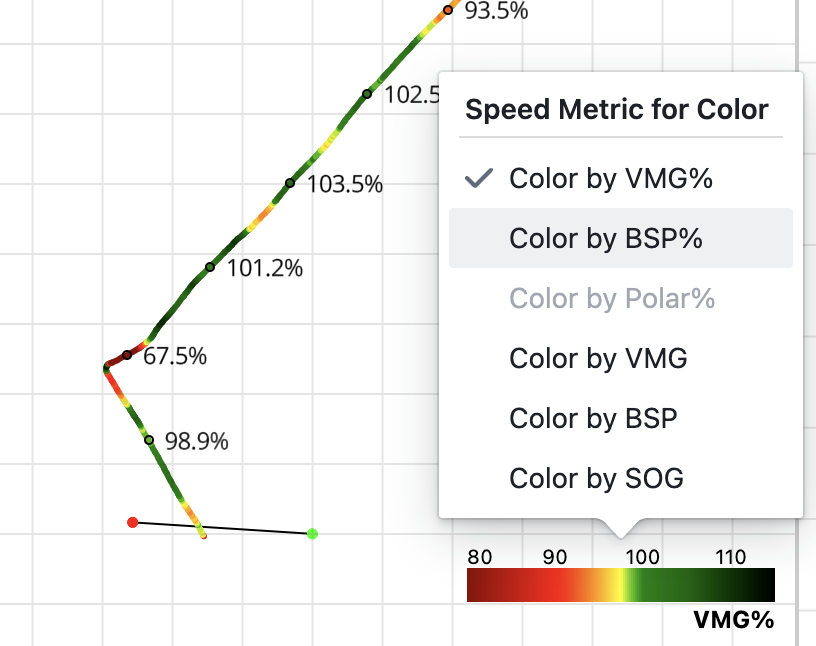
Map Mode: Speed
Click on the speed legend to change which metric is used to color the boat's track.
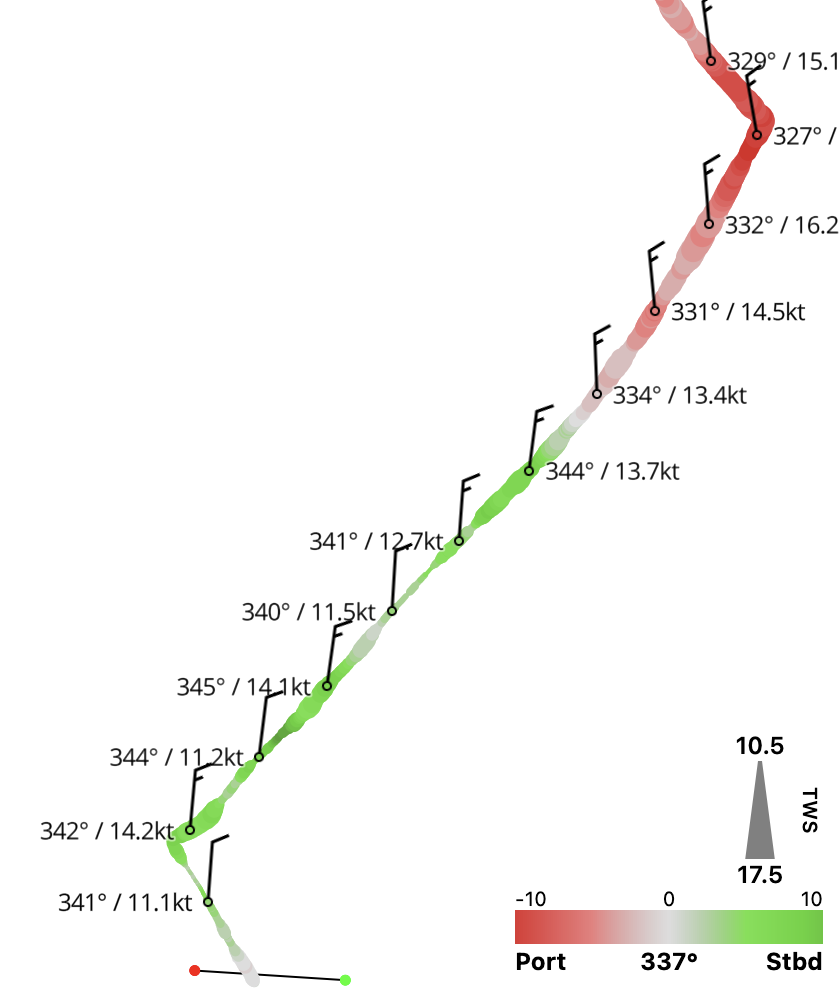
Map Mode: Tactical
In Tactical mode, the width of the track represents true wind speed (TWS, in the range shown in the legend, 10.5 to 17.5 kts in this example), and the color of the track represents shifts in true wind direction (TWD, around the average shown in the legend, 337 deg in this example).
Click on the color legend to select a coloring mode, either port/starboard or lifts/headers.
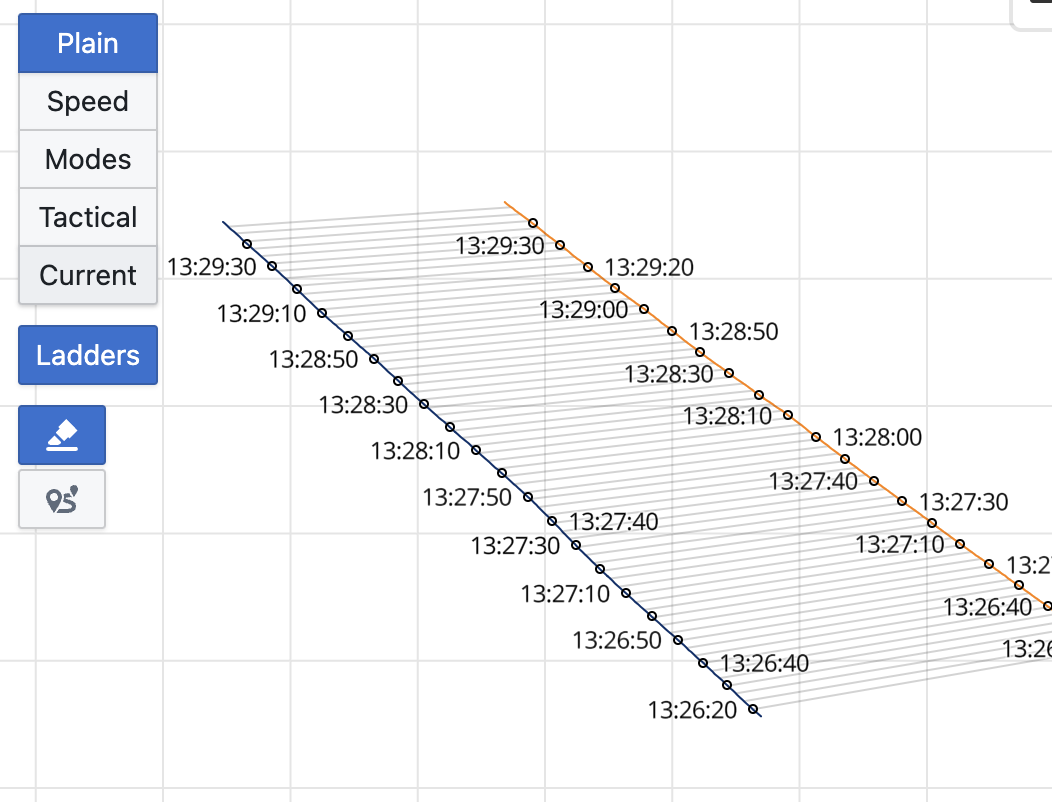
Map Tool: Ladders
When two boats are selected, click on the Ladders button to enable ladders between their tracks (connecting the boat's positions at equal times).
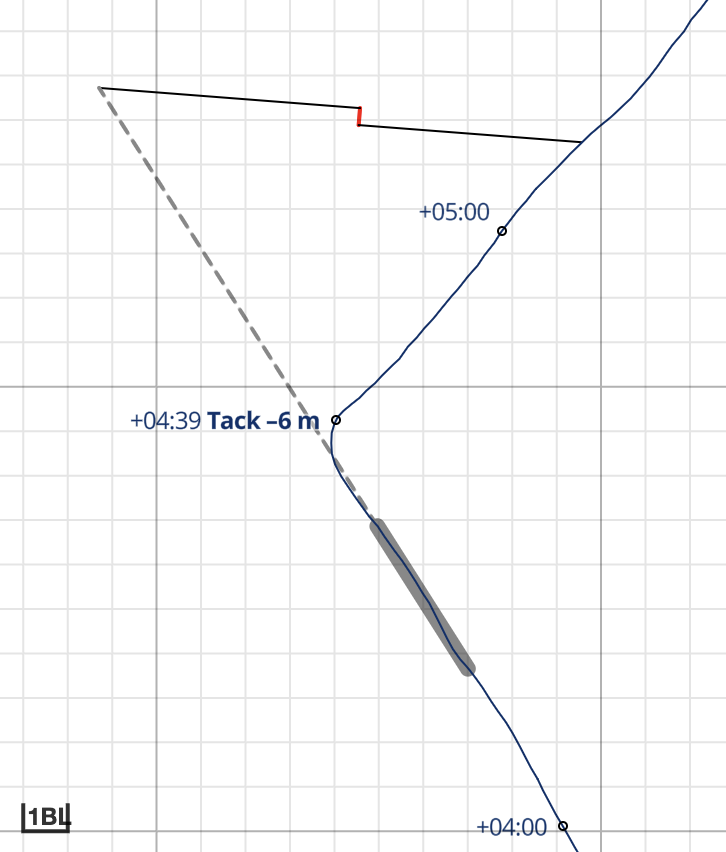
Map Tool: Maneuvers
Click on the Maneuvers button to show all analyzable maneuvers on the map, with maneuver loss calculated from average COG/SOG before the maneuver, and when zoomed in, a visualization of the loss calculation. Refer to the maneuver report for more details.