Scatter Chart

Available In Entire Day, Only Races, Aggregate all Dates in Event, individual races/trainings, Performance Database
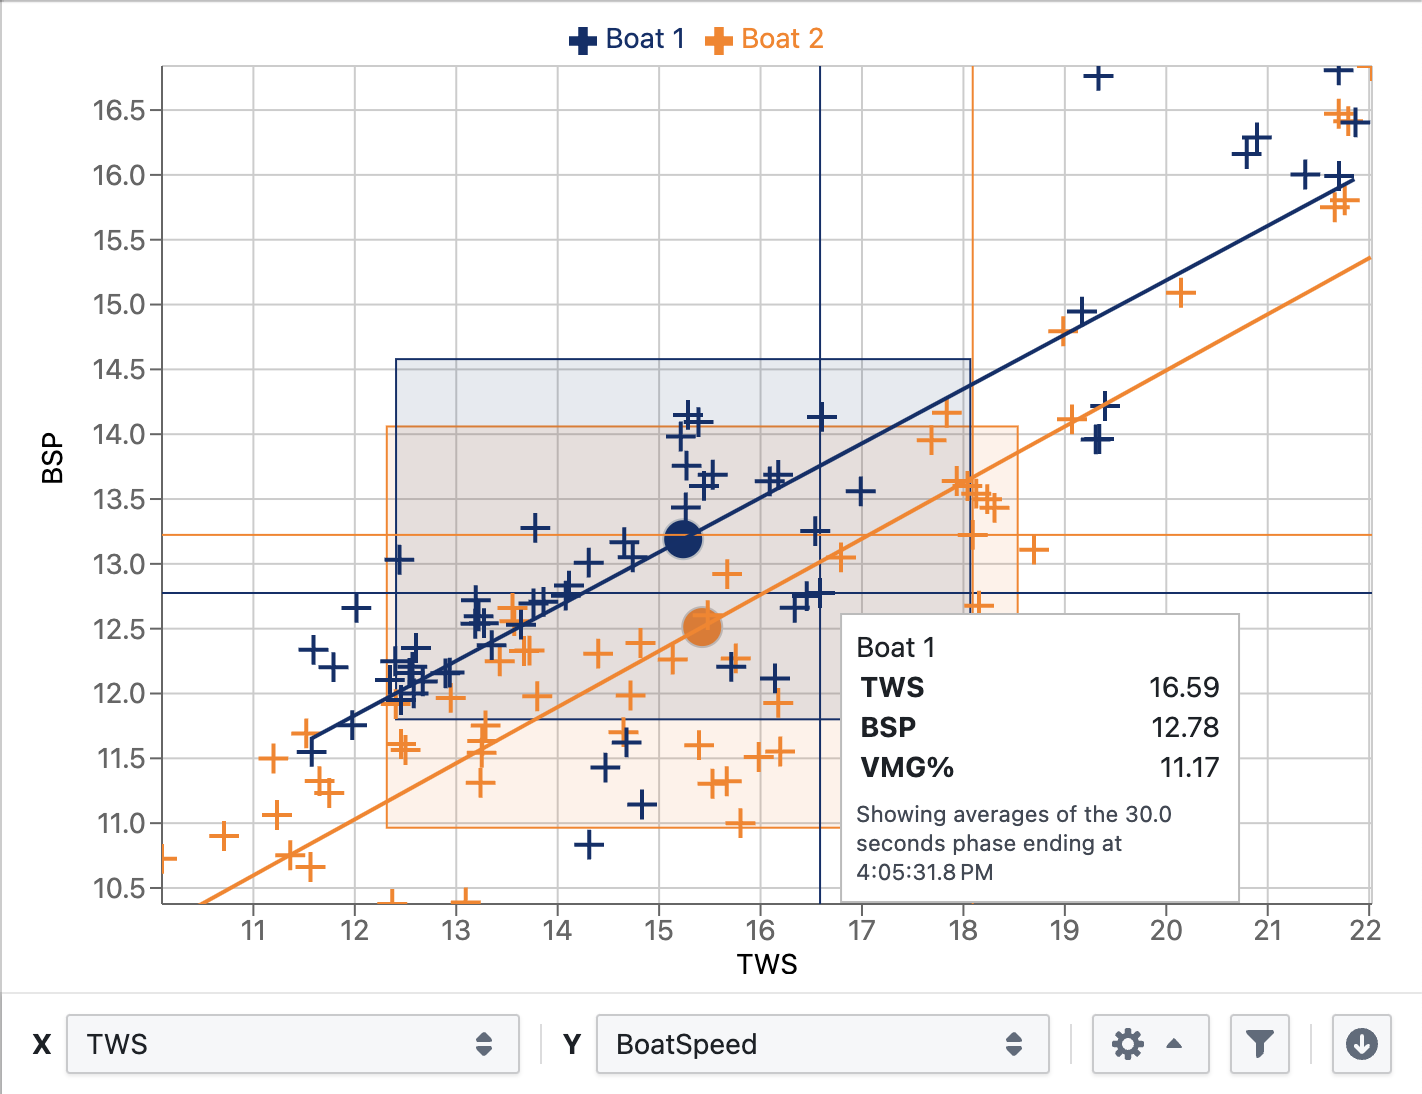
Displays a scatter chart (X/Y chart) plotting data points by two selected metrics (X and Y axis).
In all modes except the performance database, data is automatically averaged into phases of a specific duration, to achieve a reasonable number of datapoints in the chart.
Hover over a data point to see a tooltip with exact values and the corresponding timestamp / phase duration.
Scatter Chart Configuration Options
- X and Y metric: determine which metrics are used to plot points in the chart
- Phase Duration: how many seconds of data are averaged to form each data point
- Fit Curve: overlays a polynomial fit of the chosen order onto each data series, which may help indentify trends in a dataset or compare different datasets (port vs. starboard or different boats)
- Reference Areas: displays rectangles on the chart area representing the extent of data in each data series, using metrics selected for the X and Y axis, either up to the min/max of each series, or the mean of each series (displayed as a circle/dot) and spanning one standard deviation in each direction. This is especially useful for a quick visual comparison of multiple data series (boats)
- Targets: displays a purple line showing the targets for the chosen Y metric (select
TWSas the X metric). Targets can be either from the log file itself, or from a polar/targets configured for the boat. - Performance Database: adds data series for comparison from the boat's performance database
- Color by Tack: breaks down the data points into separate port/starboard data series for comparison
- Highlight Top VMG%: adds a yellow highlight to all data points whose VMG% (percentage of VMG target) lies within the top 10 percentiles of VMG% of the entire dataset
- Exclude Maneuvers: excludes any data points that lie before and after maneuvers (configurable in the boat's filter settings)
- Filter: define additional filters to narrow the data in the chart, e.g. to remove outliers that disturb the analysis