Line Chart

Available In Entire Day, individual races/trainings
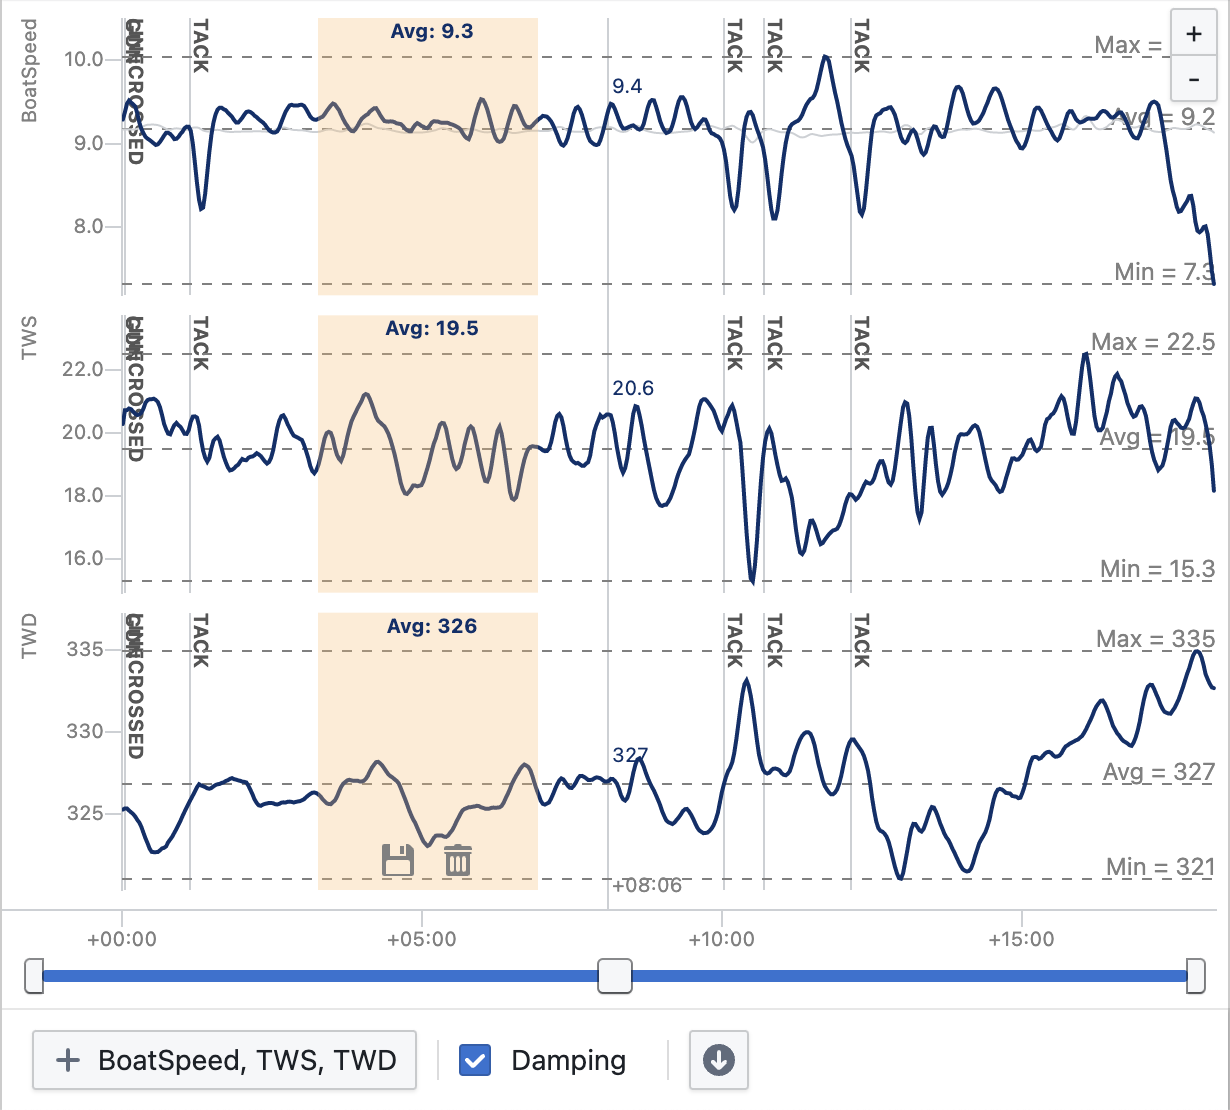
Displays a line chart (strip chart) of one or more metrics for the selected time range.
Where targets are available, they are automatically shown as a grey line together with the the main variable (e.g. BoatSpeed and TargetBoatSpeed).
Hover over the chart to highlight a point in time and get an instant reading at that time.
Click and drag on the chart area to create one or more highlighted time ranges. An instant average is shown. Click the save icon at the bottom of the area to save the highlighted time range as a new training.
Click on the +/- buttons or use the slider at the bottom of the view to zoom into the chart.
Note that for bearing metrics like TWD, COG, or Heading, a continuous line is drawn where the value wraps around 0/360 degrees. The Y axis may span more than 360 degrees in case of multiple consecutive "turns" of the bearing value.
Line Chart Configuration Options
- Select one or more metrics, which will be shown as a vertical stack of individual line charts
- Damping: applies damping to the data with a damping/moving average window size of 1/100th of the displayed time range.