Upload Boat Data and First Analytics Steps
This tutorial shows how to upload a log file to Njord Analytics, and provides a first glance at some of the visualization options available.
Step 1
Navigate to https://app.sailnjord.com/
Step 2
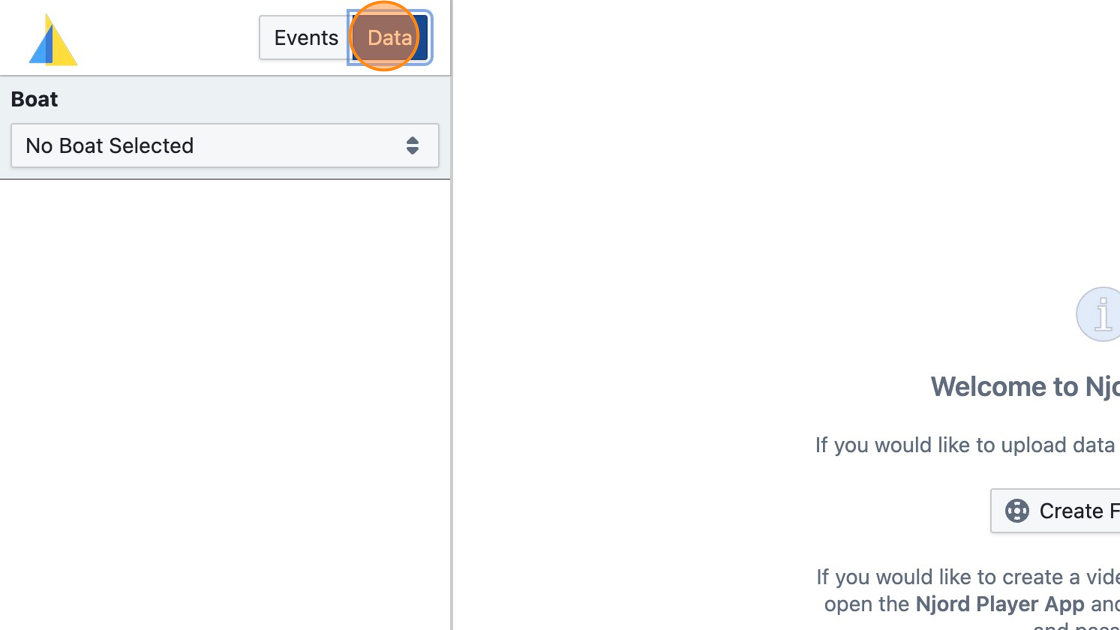
Click "Data"
Step 3
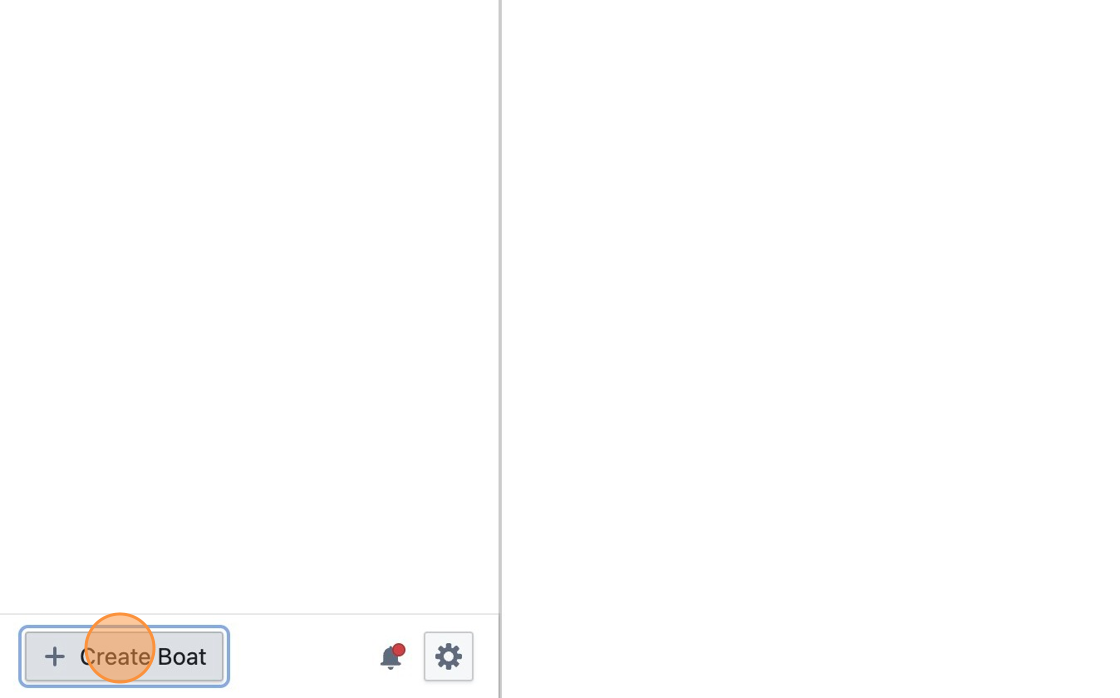
Click "Create Boat" if you haven't done this yet
Step 4
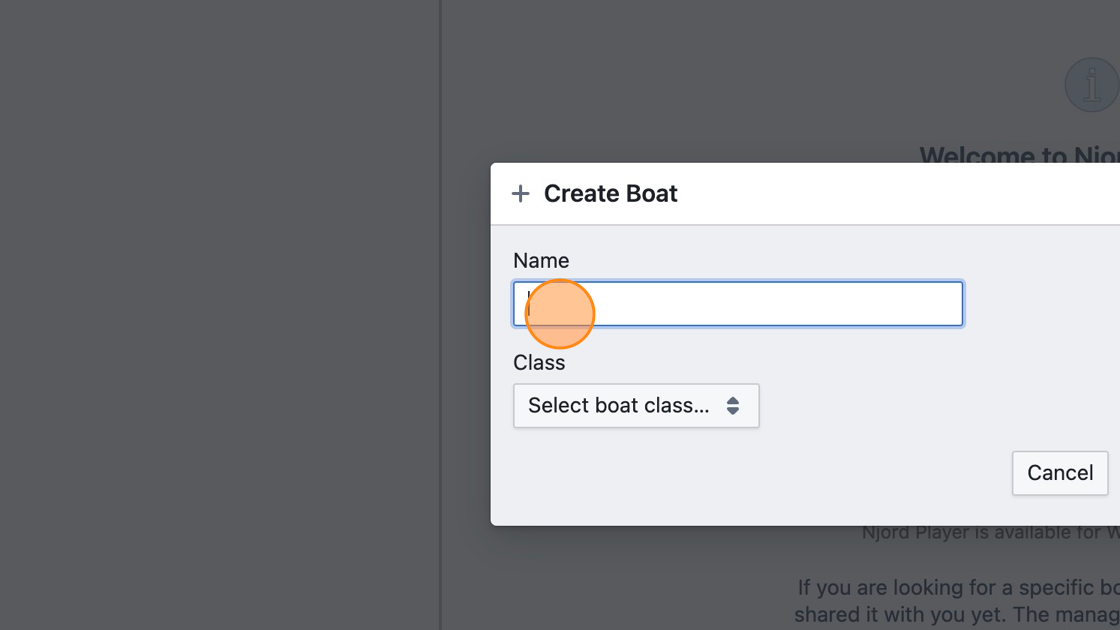
Enter the name of your boat and the boat class
Step 5
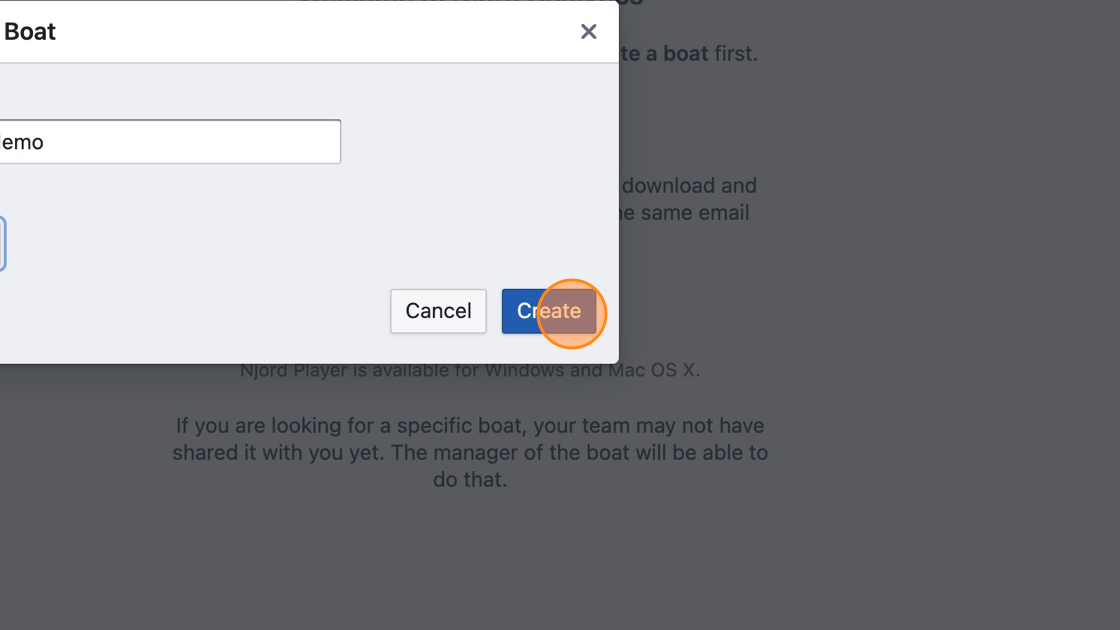
Click "Create"
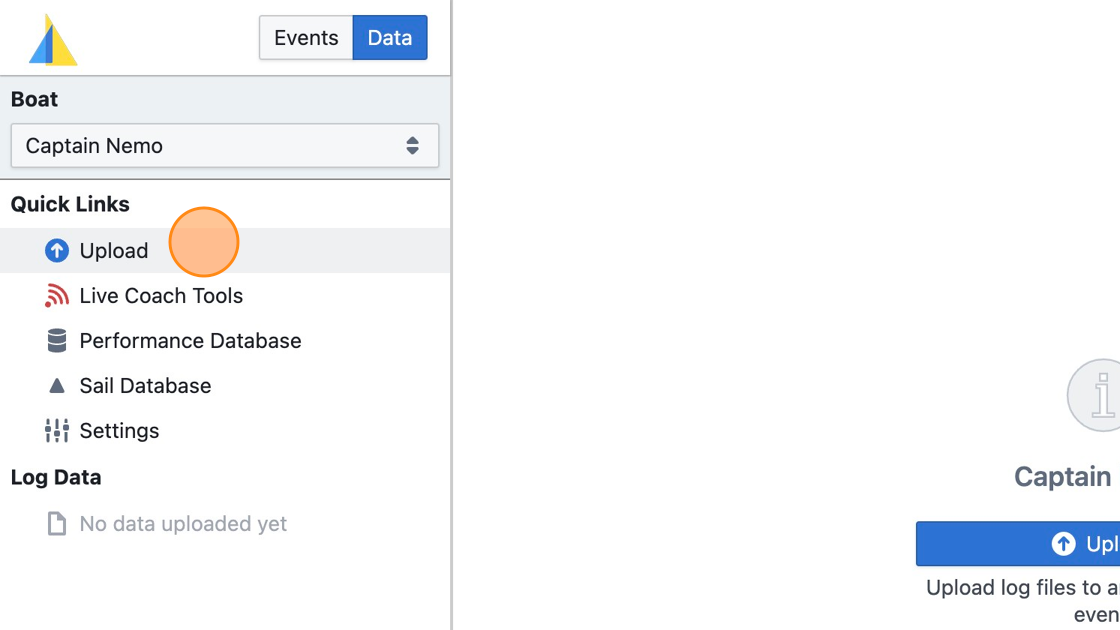
Step 6
Click "Upload"
Step 7
Click "Add Files…"
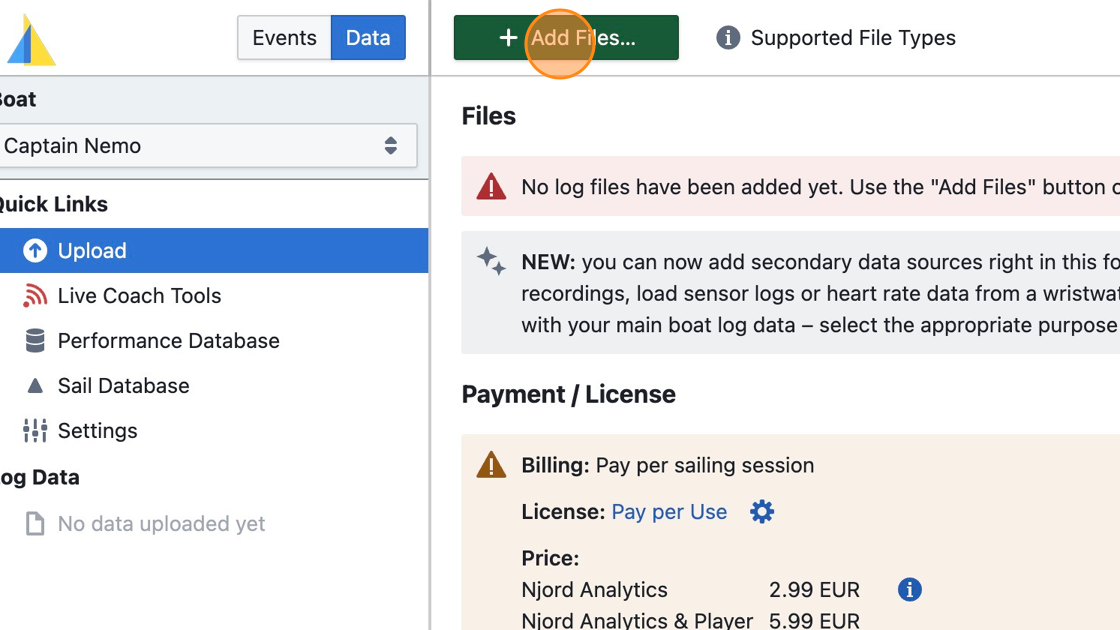
Tip: Learn more about supported data sources at https://www.sailnjord.com/data-sources/
Tip: To learn how to combine multiple data files, read Loading Heart Rate or Load Cell Data
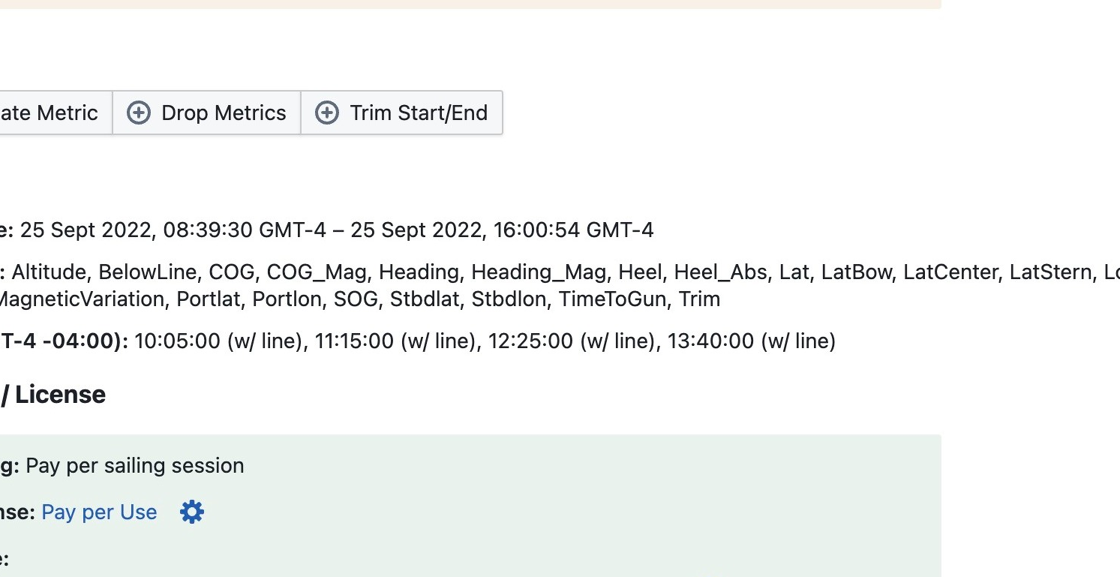
Step 8
Verify that the detected data time range matches what you expect
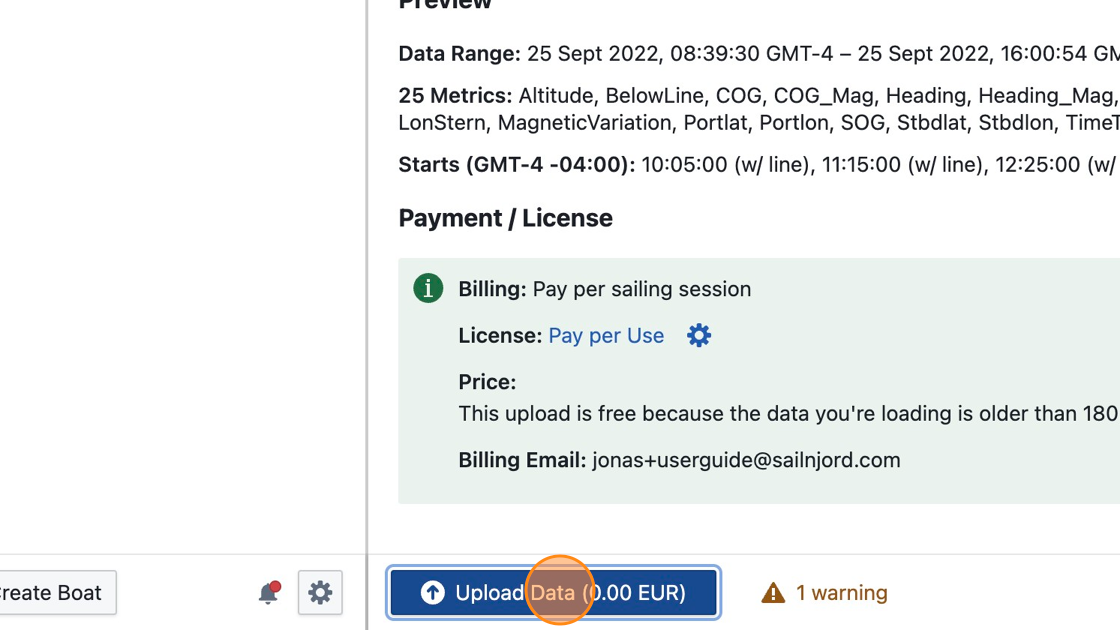
Step 9
Click "Upload Data" and wait for the data to be processed
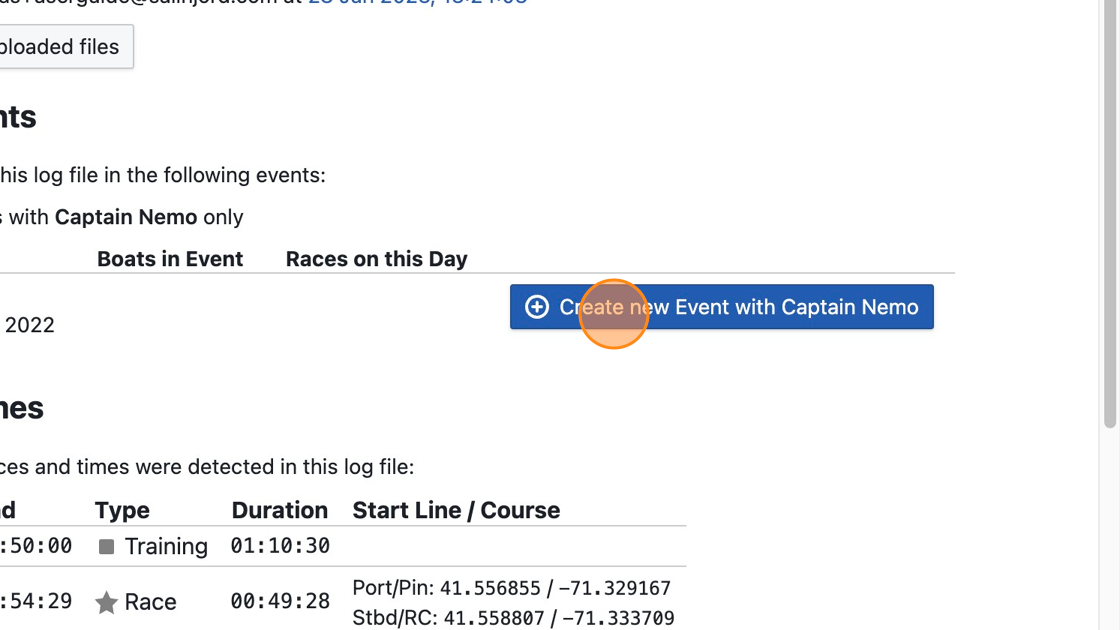
Step 10
Click "Create new Event with Your Boat"
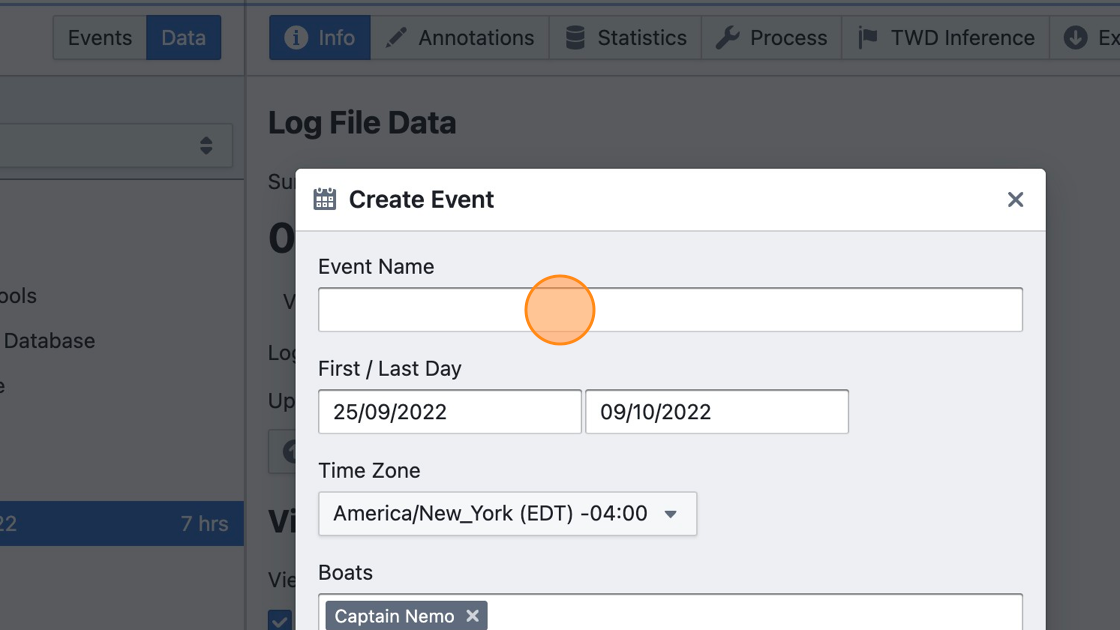
Step 11
Enter a name for the event and adjust the start/end date if necessary
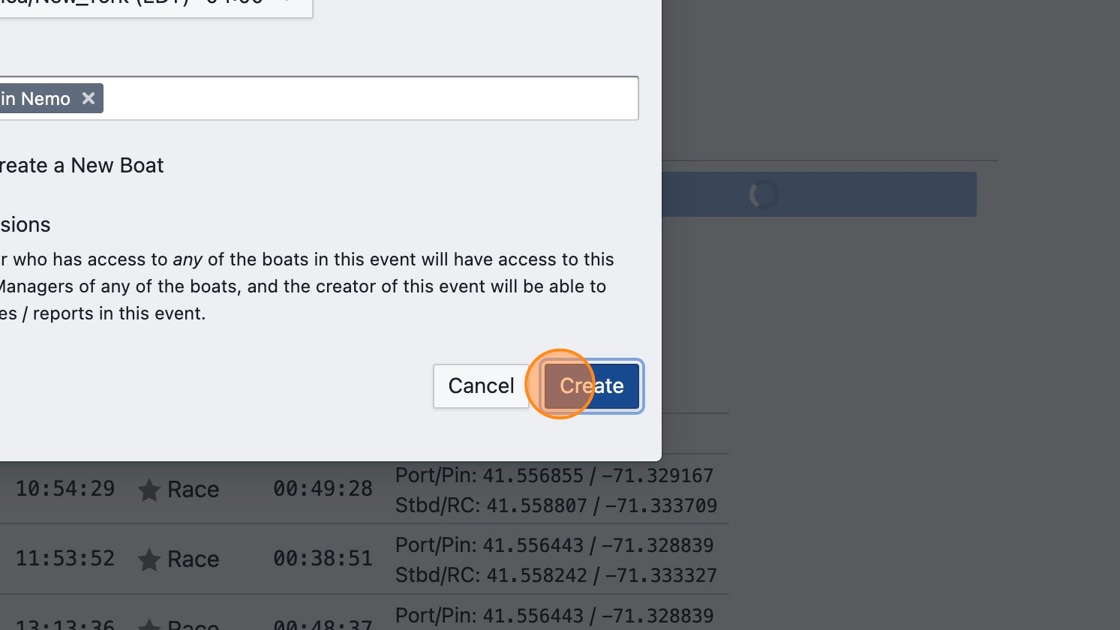
Step 12
Click "Create"
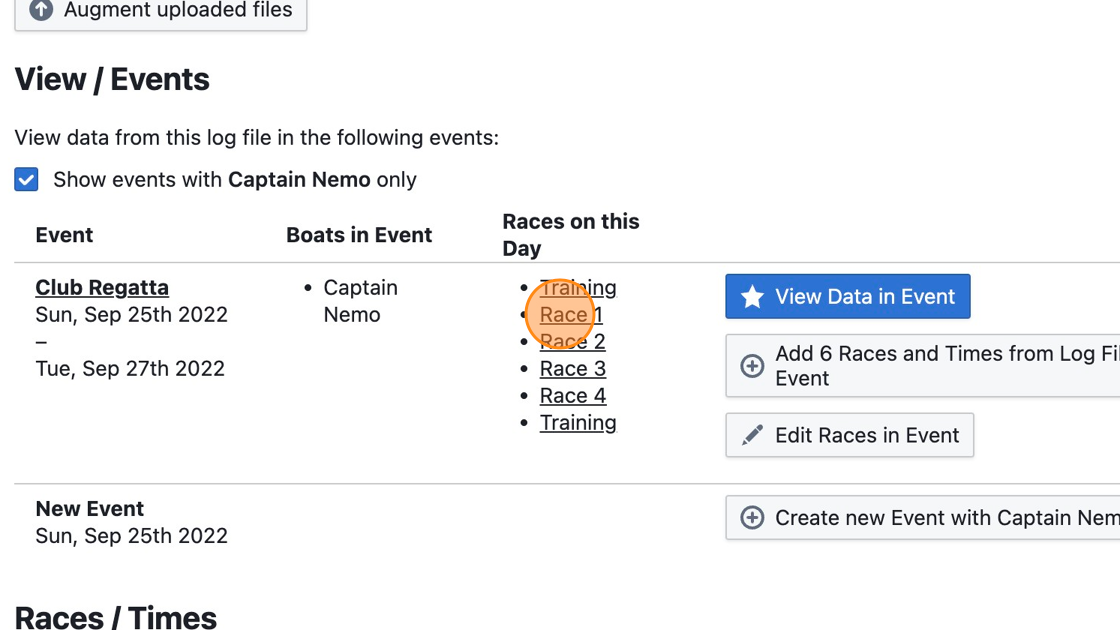
Step 13
Training and Race times will be copied to the new event automatically. Click on "Race 1" or "Training" to view the uploaded data.
Step 14
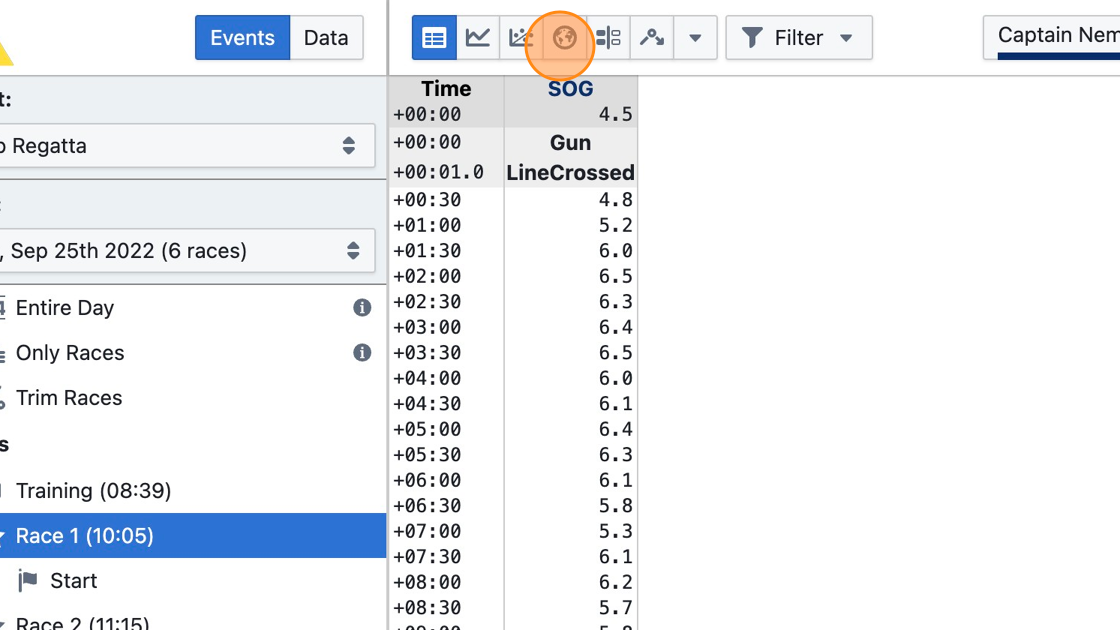
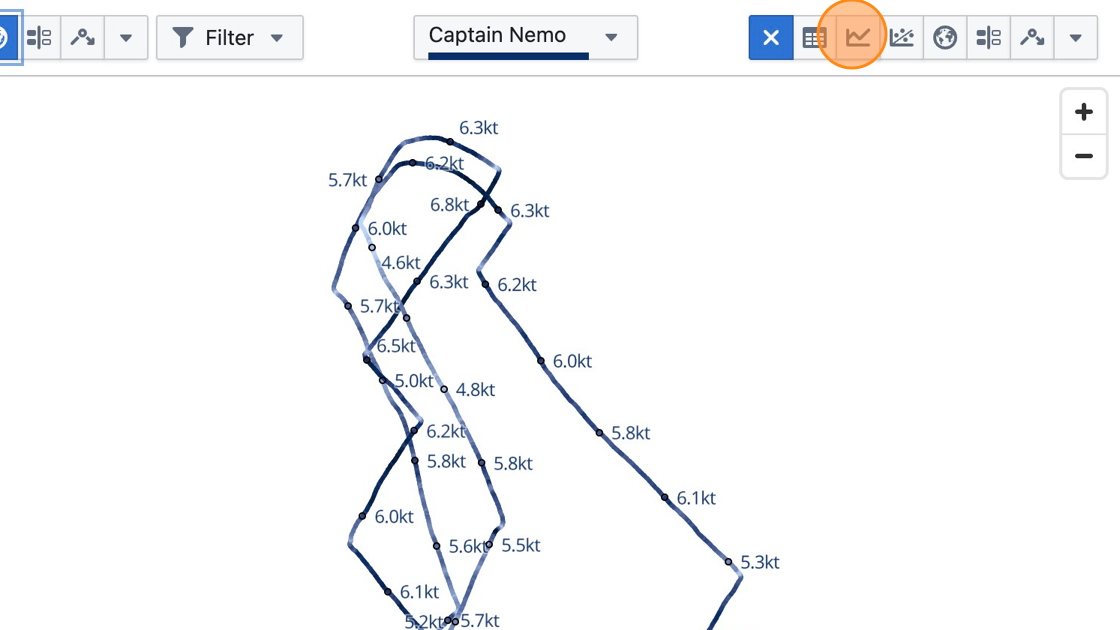
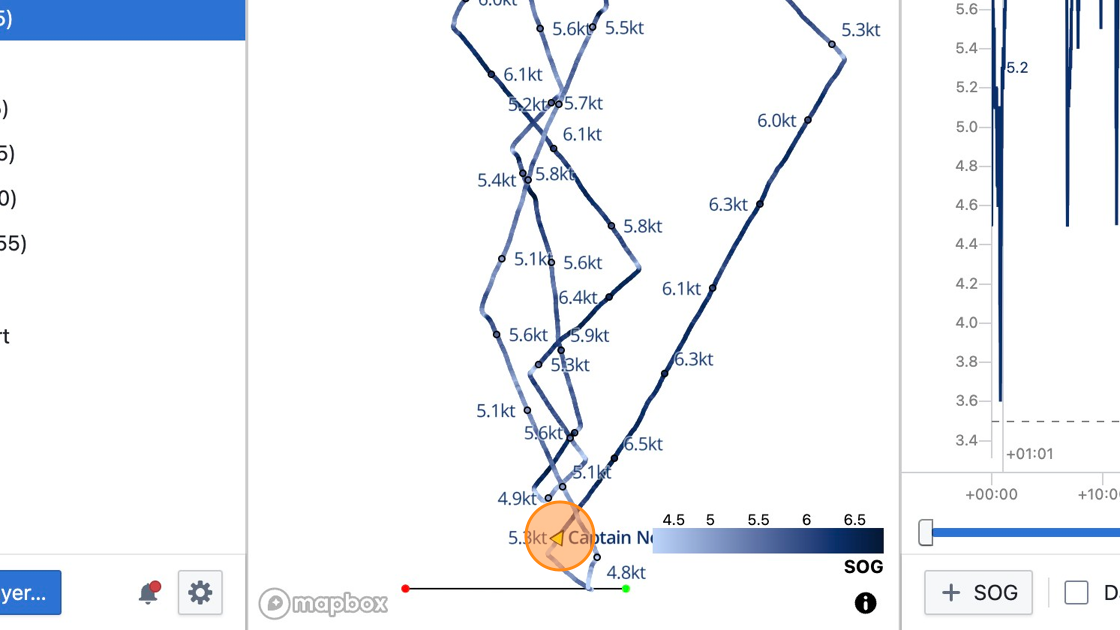
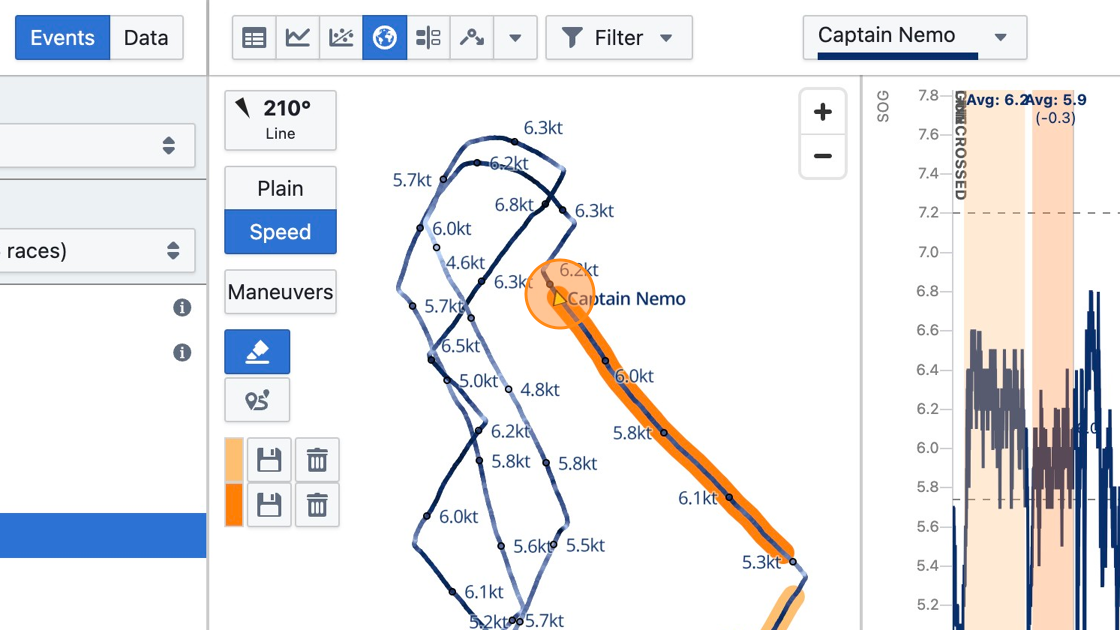
Choose from the available visualizations, such as the map view
Step 15
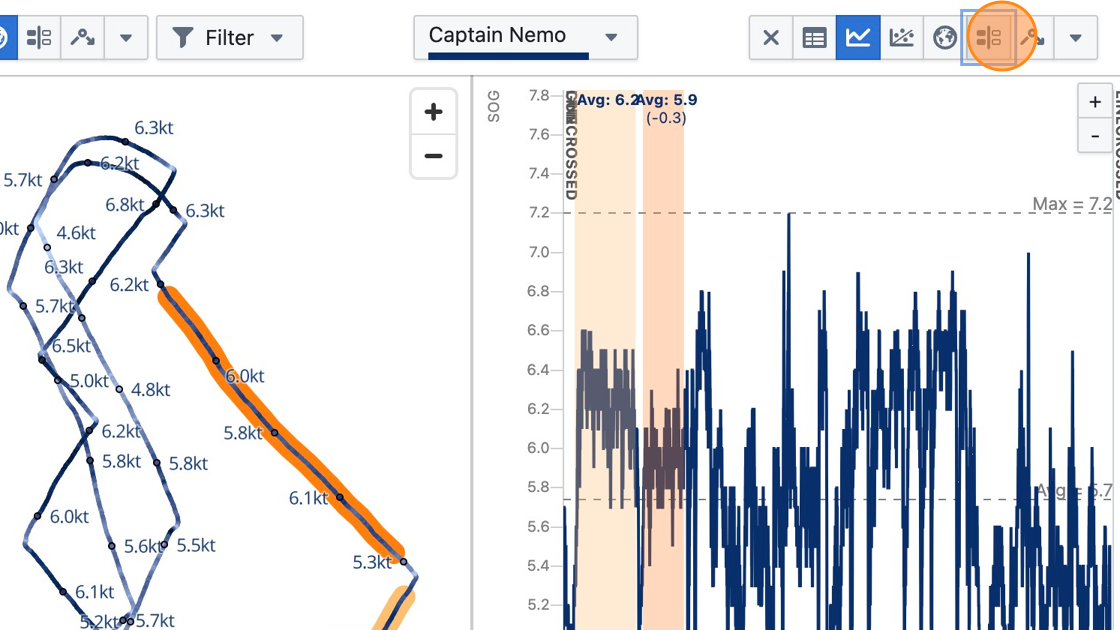
Choose a second view type to show side by side
Step 16
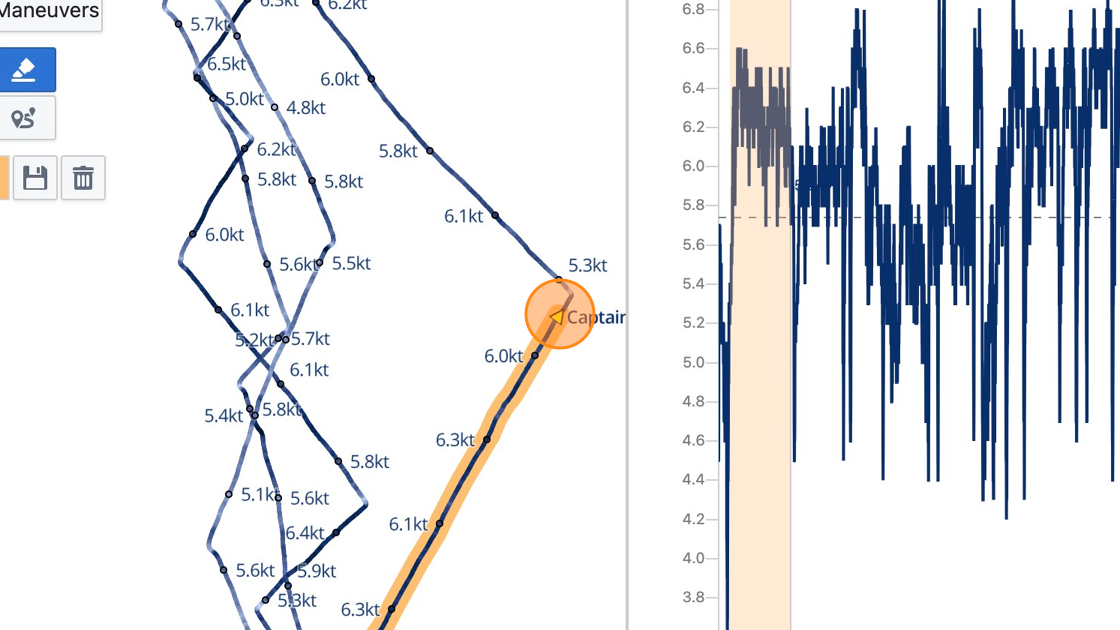
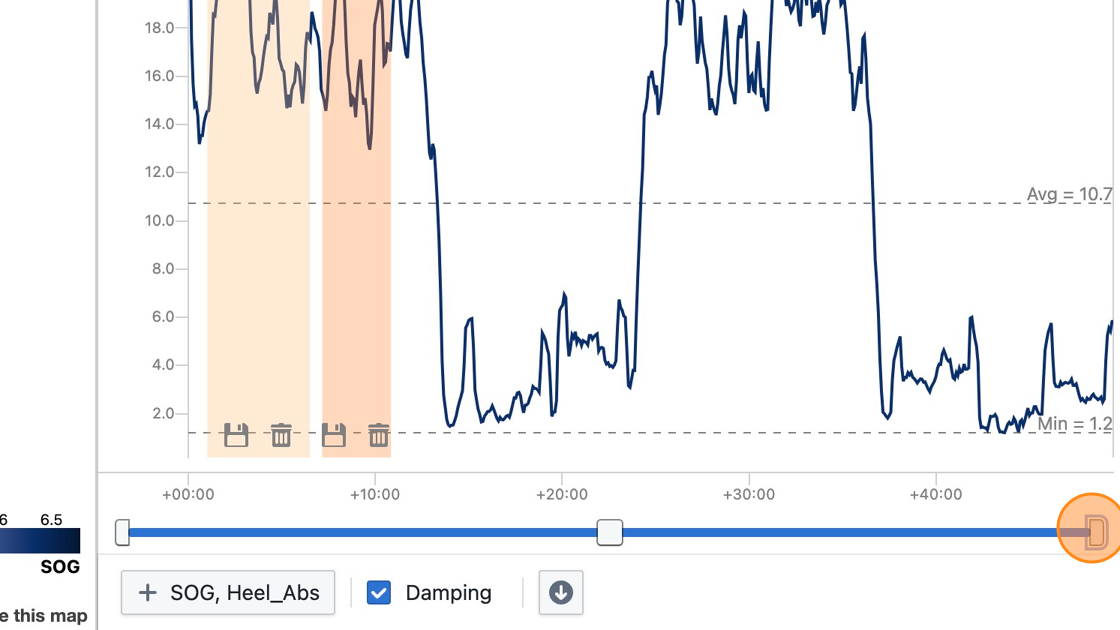
To highlight a range of data, click on the track of the boat (this also works in the line chart, for example)
Step 17
Click again to mark the end of the highlighted time range
Step 18
Repeat as necessary to highlight more time ranges
Step 19
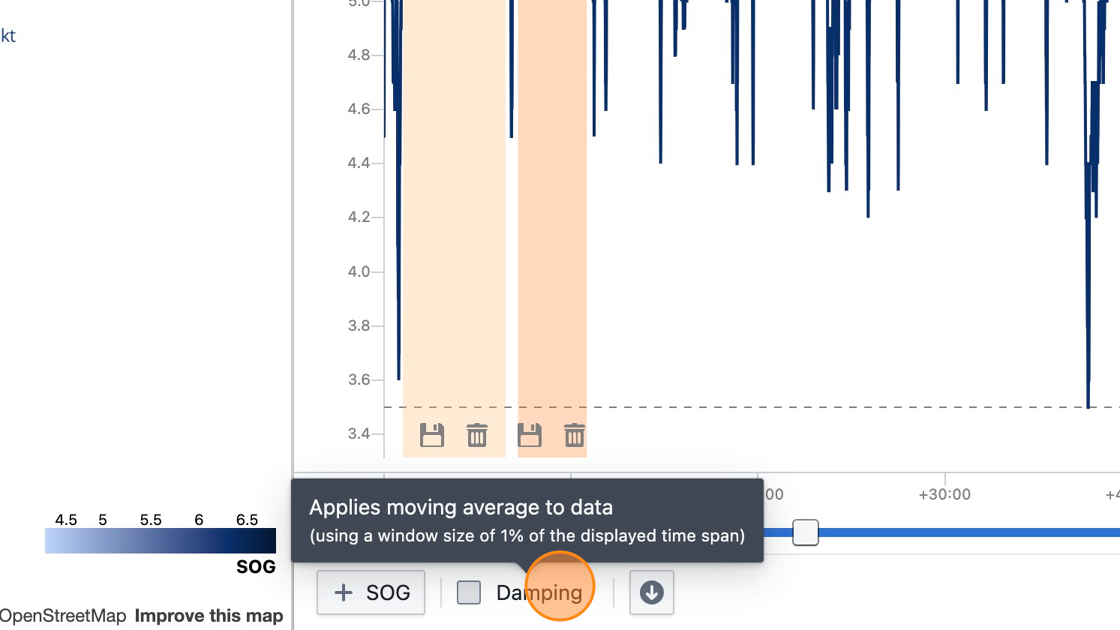
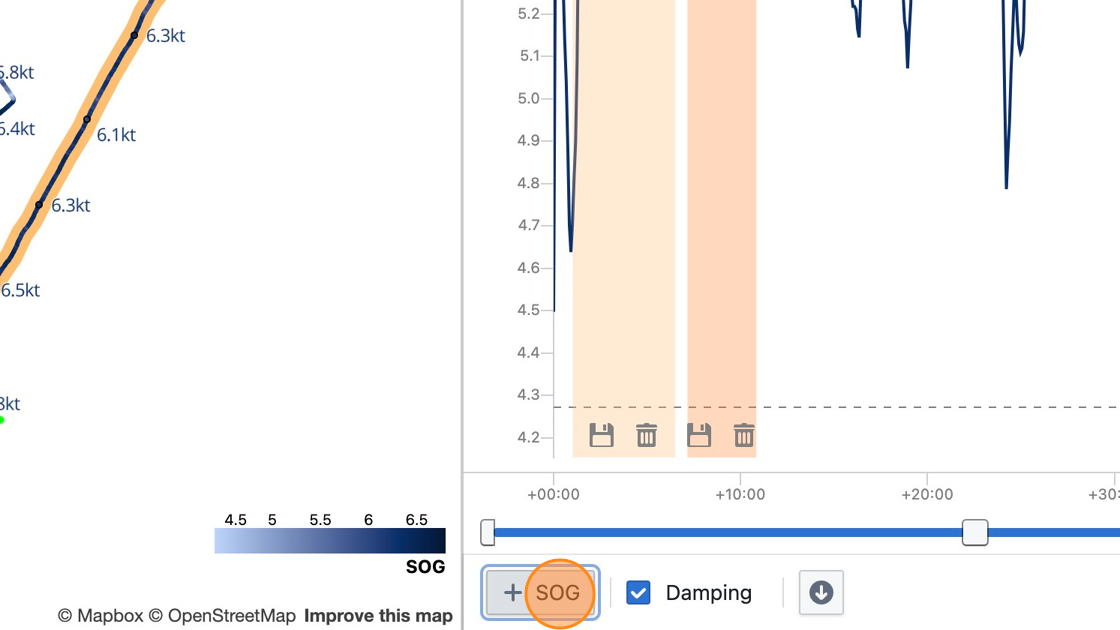
Click "Damping" to enable damping
Step 20
Click the plus button to add more variables
Step 21
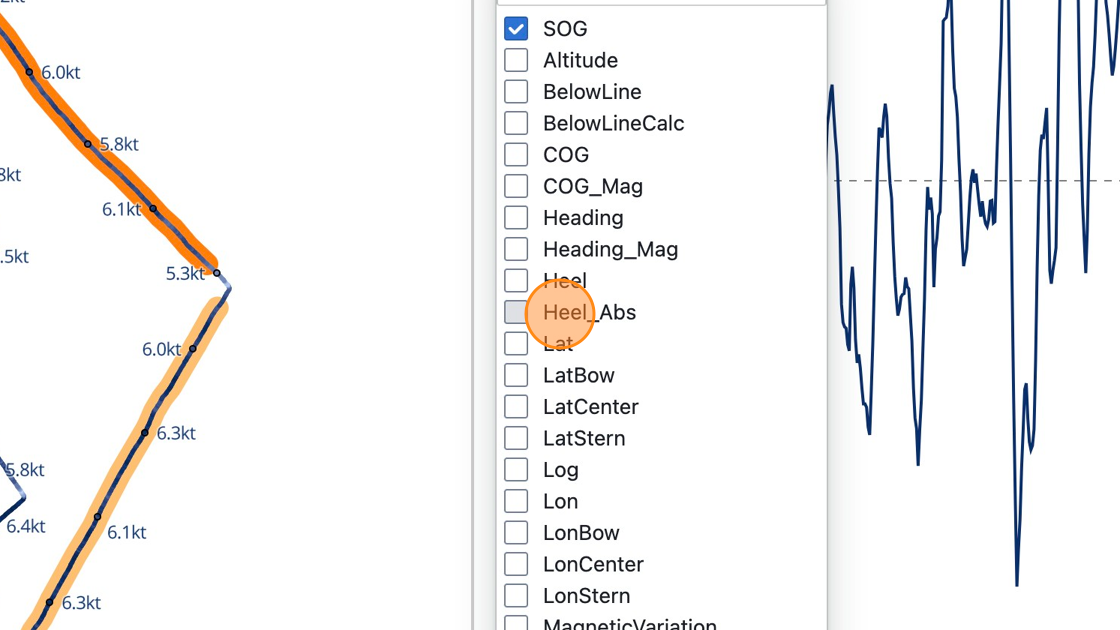
Select a variable you'd like to add to the line chart
Step 22
Click and drag the handle to zoom into the line chart
Step 23
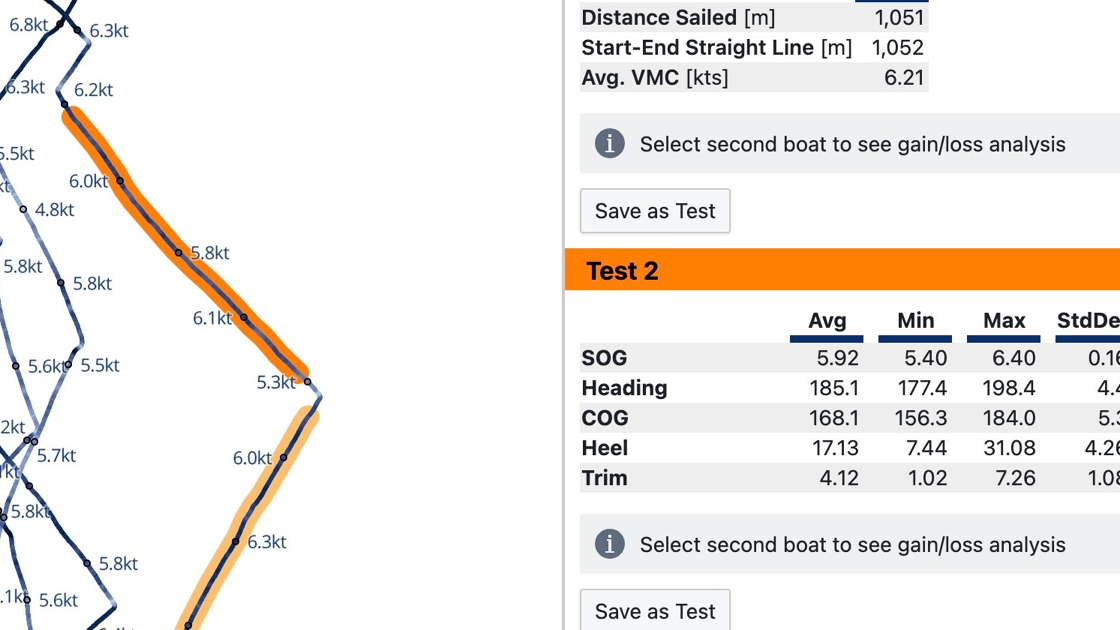
Select the "Statistics" view to see detailed stats for the highlighted time ranges
Step 24
Statistics shown include average, minimum and maximum values. Click "Settings" to show more variables.
Tip: Learn more about available visualization types at https://app.sailnjord.com/help/analytics/visualizations.html